
7 Best Indicators for Swing Trading in 2026
Blog by Aliceblue News Desk
02 April 2026
14 minutes
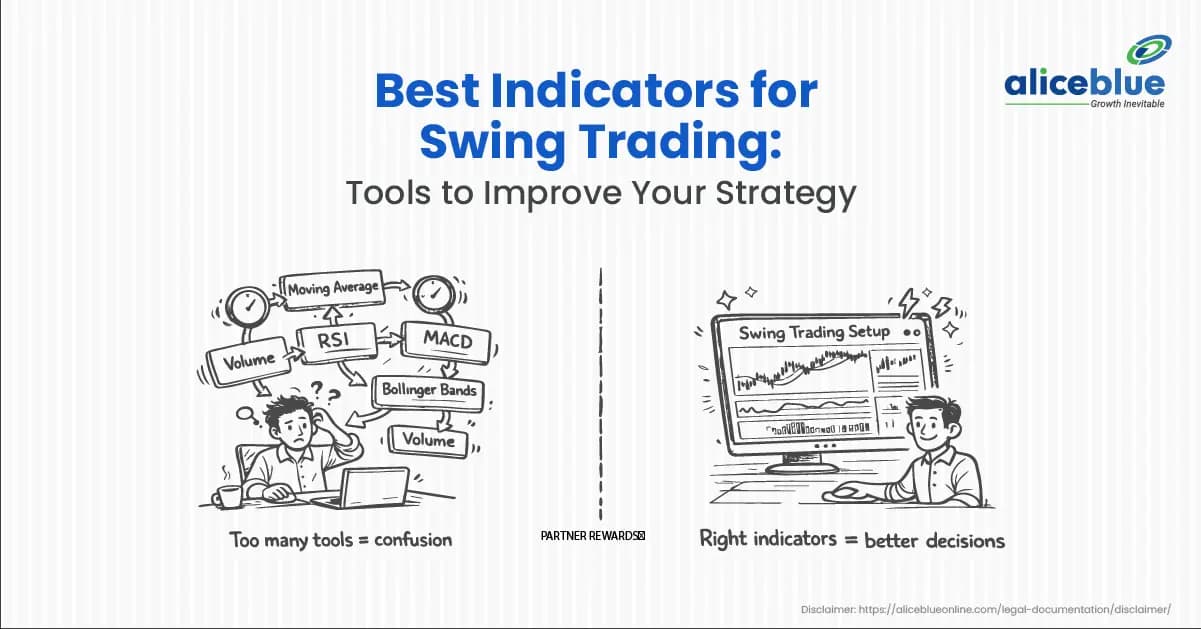
Most traders fail not because they lack indicators, but because they use too many without a clear strategy.
In this guide, we’ll break down the best indicators for swing trading, how they work, and how you can combine them to build a smarter and more consistent trading strategy.
What is Swing Trading?
Swing trading is a short-to-medium-term strategy where investors hold stocks or other financial assets for ‘several days to several weeks’ to capitalize on price “swings” or momentum.
Unlike day trading, these positions are held overnight, aiming to profit from anticipated price movements identified through technical analysis.
Why Indicators Matter in Swing Trading
Markets are driven by emotions: fear, greed, speculation. Indicators help remove that emotional bias by giving you data-driven signals.
They help in:
- Identify trends
- Improve entry and exit timing
- Measure momentum and strength
- Assist in managing risk
The 7 Best Indicators for Swing Trading in 2026
Here are the most effective swing trading indicators and how to actually use them.
1) Moving Averages (MA)
Best for: Identifying trend direction
Moving averages smooth out price data to show the overall trend.
SMA (Simple Moving Average):
Average price over a period
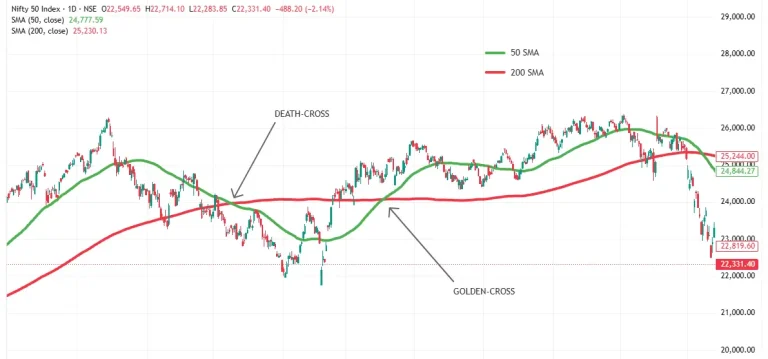
50-day SMA + 200-day SMA → This pair is considered one of the most reliable for Indian markets.
- Golden Cross: 50-day SMA crosses above 200-day SMA → Strong bullish signal (widely followed for Nifty/Sensex positional trades).
- Death Cross: Opposite → Bearish signal. Many Indian sources highlight this as a stable trend signal on daily/weekly charts.
Most effective/popular SMA periods for Indian stocks:
Trading Style | Best SMA Periods | Primary Use in the Indian Market | Example Strategy |
Intraday / Day Trading | 5, 8, 13 or 9-20 period (on 5/15-min charts) | Quick momentum, entry/exit in volatile sessions (e.g., Bank Nifty) | 5-8-13 SMA combo for trend shifts |
Swing Trading | 20-50 days | Medium-term swings (a few days to weeks) | 20/50 crossover |
Positional / Investment | 50-day + 200-day (most popular) | Long-term trend & major reversals (Nifty, Sensex, blue-chips) | Golden/Death Cross |
Long-term Investing | 100-200 days | Major market bias & portfolio decisions | Price above 200-day SMA = stay invested |
EMA (Exponential Moving Average):
Gives more weight to recent prices.
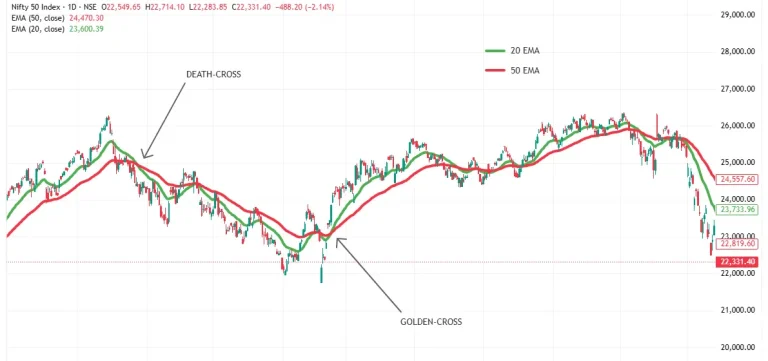
20 EMA → Your “fast lane” for entries/exits.
50 EMA → The single most reliable trend filter for swing traders in India.
200 EMA → Long-term anchor (use with 50 EMA for Golden Cross).
Many professional traders use a 20/50 EMA crossover on daily charts for swing trades (price above both + 20 crossing above 50 = strong buy)
Why it works:
Swing trading depends heavily on trend direction. Moving averages help you stay on the right side of the market.
How to use it:
- Price above MA → Uptrend
- Price below MA → Downtrend
- Crossovers signal potential reversals
Best settings:
- 20 EMA → Short-term trend
- 50 EMA → Medium-term trend
- 200 EMA → Long-term trend
Most effective EMA periods for Indian stocks:
Trading Style | Best EMA Periods | Primary Use in the Indian Market | Why Traders Love It |
Short-term Swing (2–5 days) | 9 & 21 EMA or 20 EMA | Quick momentum entries on Nifty/Bank Nifty | Fastest signals, great for pullback buys |
Core Swing Trading (5–15 days) | 20 EMA + 50 EMA (most popular combo) | Medium-term trend + entry timing | 50 EMA is the “sweet spot” for Indian swings |
Positional / Medium-term | 50 EMA + 200 EMA | Major trend filter & Golden/Death Cross | 50 EMA = institutional trend; 200 EMA = big-picture bias |
Long-term Investing | 100 EMA or 200 EMA | Overall market health (Nifty above 200 EMA = stay invested) | Filters out noise during corrections |
Difference between SMA and EMA (Simple Moving Average vs Exponential Moving Average)
Feature | SMA (Simple Moving Average) | EMA (Exponential Moving Average) |
Calculation | Equal weight to all prices in the period (Just add closing prices and divide by the number of days) | More weight to recent prices (exponential decay). Formula: EMA = (Close × multiplier) + (Previous EMA × (1 – multiplier)) Multiplier = 2 / (Period + 1) |
Responsiveness | Slower / more lag | Faster / less lag |
How it looks on the chart | Smoother line, farther from the current price | Sticks closer to price action |
Best for | Long-term trend confirmation, fewer false signals | Short-to-medium term trading, quicker signals |
Drawback | Can miss early trend changes | More whipsaws (false signals) in choppy markets |
Indian trader preference | Traditional & stable (especially 200-day) | Preferred by most active traders |
Many traders prefer EMA over SMA because it reacts faster to price changes, making it best for swing trading.
2) Relative Strength Index (RSI):
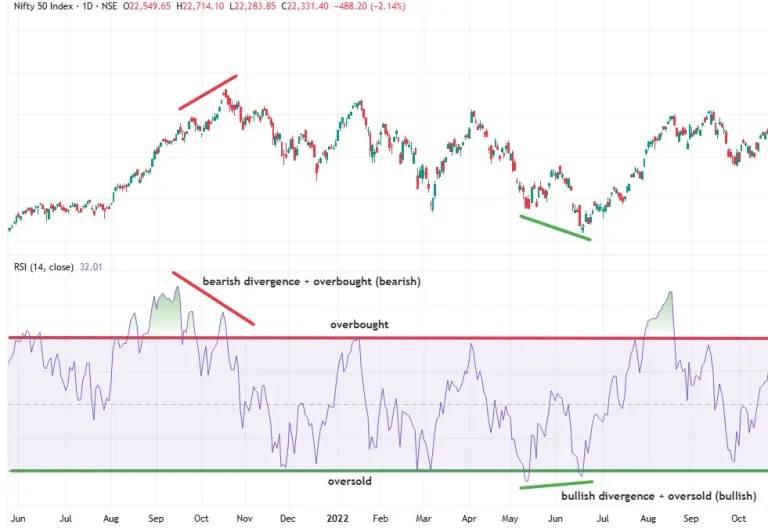
Best for: Identifying overbought and oversold conditions. It tells when a stock is overbought (time to sell) or oversold (time to buy).
RSI is a momentum indicator that ranges from 0 to 100.
- Above 70 → Overbought
- Below 30 → Oversold
Why it works:
Markets often pull back after extreme moves. RSI helps spot those turning points.
How to use it:
- Buy when RSI is below 30 (in an uptrend market)
- Sell when RSI is above 70
Best setting:
14-period, levels 30/70
Main Trading Signals:
- Bullish Divergence: Price makes lower lows (continuing to fall), but RSI makes higher lows. → Bearish momentum is weakening even as price drops → Potential upward reversal (buy signal). Most reliable when RSI is in oversold territory (below 30–40).
- Bearish Divergence: Price makes higher highs (continuing to rise), but RSI makes lower highs. → Bullish momentum is fading → Potential downward reversal (sell/short signal). Most reliable when RSI is in overbought territory (above 60–70).
- Hidden Bullish Divergence: Price makes a higher low (during an uptrend pullback), but RSI makes a lower low. → The uptrend remains strong; the pullback is temporary → Good for buying the dip (continuation upward).
- Hidden Bearish Divergence: Price makes a lower high (during a downtrend rally), but RSI makes a higher high. → The downtrend remains dominant; any rally is weak → Good for selling/short on rallies (continuation downward).
Don’t use RSI alone; combine it with trend indicators like moving averages for better accuracy.
3) MACD (Moving Average Convergence Divergence)
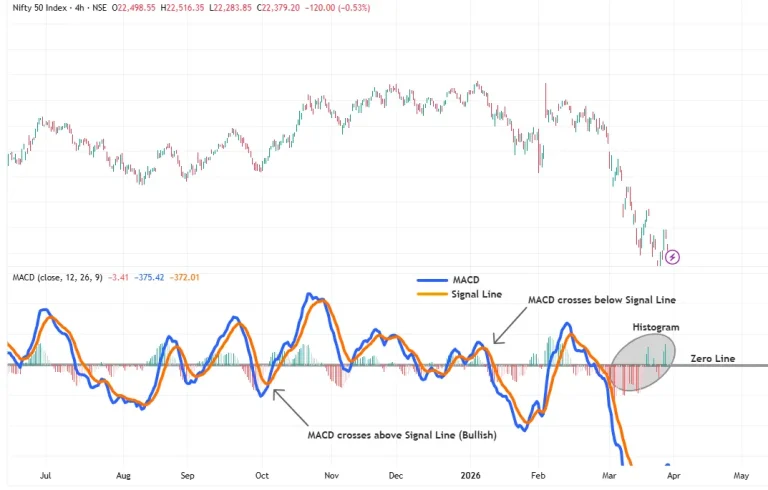
Best for: Trend confirmation and momentum
MACD shows the relationship between two moving averages, shows momentum shifts, and trend strengths.
Components:
- MACD Line = 12-period EMA – 26-period EMA
- Signal Line = 9-period EMA of the MACD Line
- Histogram = MACD Line – Signal Line
Default settings:
12, 26, 9
These work perfectly on daily charts, and for swing trading Nifty 50, Bank Nifty, and liquid stocks.
Best Ways to Use MACD in Indian Stocks:
Signal Type | What to Look For | Action in the Indian Market | Reliability |
MACD Line Crossover | MACD crosses above Signal Line | Bullish → Buy swing (long) | High |
MACD Line Crossover | MACD crosses below Signal Line | Bearish → Exit or short bias | High |
Histogram Flip | Histogram turns positive (green bars growing) | Momentum building → Strong buy | Very High |
Histogram Flip | Histogram turns negative (red bars growing) | Momentum fading → Exit | Very High |
Zero Line Cross | MACD crosses above 0 | Strong uptrend confirmation | High |
Zero Line Cross | MACD crosses below 0 | Strong downtrend confirmation | High |
MACD works best in trending markets.
4) Bollinger Bands
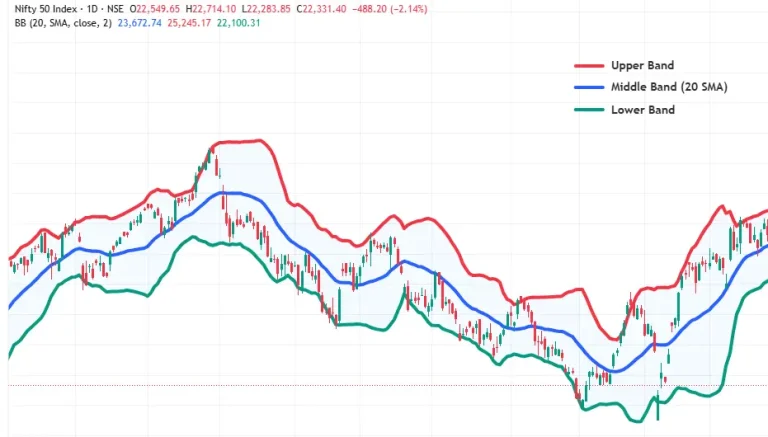
Best for: Volatility and breakout signals
Components:
- Middle Band (20 SMA)
- Upper Band
- Lower Band
How to use it:
-
- Price near lower band → Potentially oversold
- Price near upper band → Potentially overbought
- Take profit near the middle band
Why it works:
It adapts to market volatility, helping traders spot breakouts and reversals.
A Bollinger Band squeeze often signals a big move coming.
5) Stochastic Oscillator
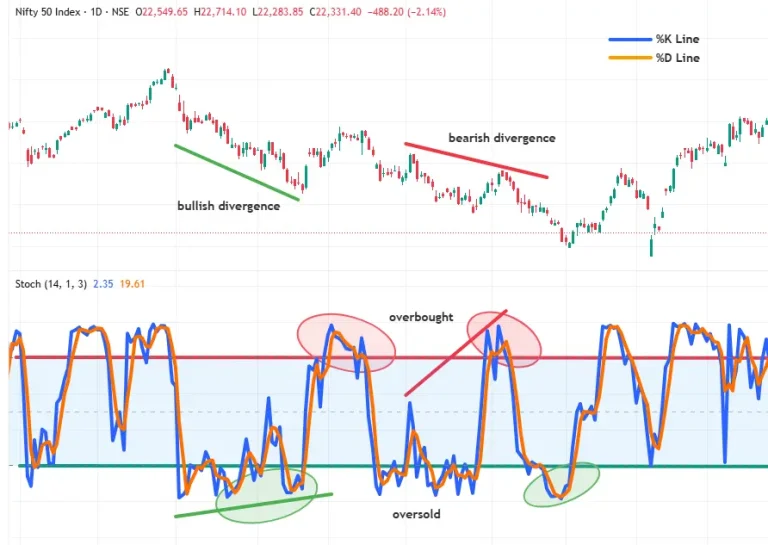
Best for: Spotting reversals early
Like RSI, it ranges from 0 to 100.
- Above 80 → Overbought
- Below 20 → Oversold
Why it works:
It reacts faster than RSI, making it useful for early signals.
Main Trading Signals:
- Overbought/Oversold Strategy:
- Buy when Stochastic rises above 20 from oversold territory.
- Sell when Stochastic falls below 80 from overbought territory.
- Best in sideways or range-bound markets.
- Crossover Strategy:
- Bullish: %K crosses above %D (especially near oversold).
- Bearish: %K crosses below %D (especially near overbought).
- Divergence (Powerful reversal signal):
- Bullish divergence: Price makes lower lows, but Stochastic makes higher lows → Potential upward reversal.
- Bearish divergence: Price makes higher highs, but Stochastic makes lower highs → Potential downward reversal.
- Hidden Bullish Divergence: Price makes higher lows, but the Stochastic makes lower lows. → Occurs during an uptrend → Suggests the uptrend will continue (pullback is temporary).
- Hidden Bearish Divergence (this is the one you specifically asked for): Stochastic makes higher highs, but price shows lower highs. → Occurs during a downtrend → Suggests the downtrend will continue (any minor rally is weak). The oscillator shows stronger upside momentum during a rally, but price fails to make a higher high — indicating the downtrend remains dominant.
6) Volume Indicators:
Best for: Confirming trends
Volume shows how strong a price move really is.
Key insights:
- Rising price + high volume → Strong trend
- Rising price + low volume → Weak move
Why it works:
Price moves without volume often fail; volume adds confirmation.
Always check volume before entering a trade.
7) Fibonacci Retracement:
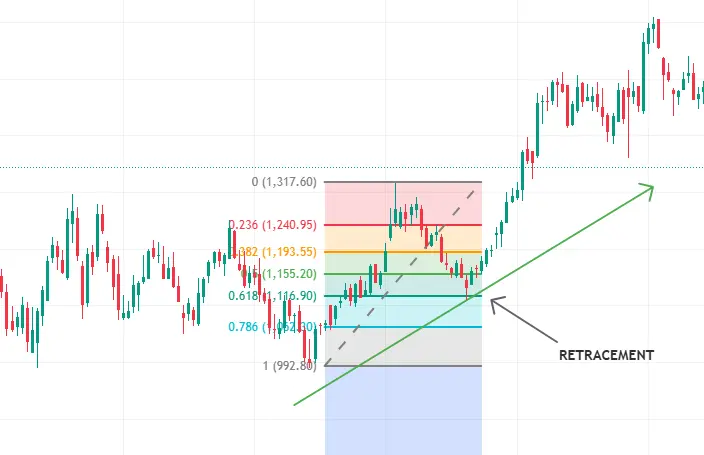
Best for: Support and resistance levels
Fibonacci levels include:
23.6%, 38.2%, 50%, 61.8% (golden ratio), 78.6%
How to use it:
- Look for pullbacks to these levels
- Enter when the price shows a reversal
Why it works:
Markets often retrace before continuing trends; these levels act as psychological zones.
The 61.8% is especially important for strong reversals.
Best Indicator Combinations for Swing Trading
Using a single indicator is risky. Combining them improves accuracy.
Effective combinations:
- Moving Average + RSI → Trend + entry timing
- MACD + Volume → Momentum confirmation
- Bollinger Bands + RSI → Reversal setups
Common Mistakes to Avoid
Even with the best indicators, traders often fail due to simple mistakes:
- Using too many indicators
- Ignoring the overall trend
- Taking signals blindly
- Not using stop-loss
Tips to Improve Your Swing Trading Strategy
- Stick to 2-3 reliable indicators
- Always use stop-loss
- Backtest your strategy
- Focus on risk-reward (at least 1:2 risk-to-reward ratios)
- Avoid emotional decisions while trading, and stay disciplined.
Conclusion
The key takeaway is simple: less is more. Instead of cluttering your charts with too many indicators, focus on 2-3 that complement each other.
For example, combining a trend indicator (like 20/50 EMA) with a momentum tool (like RSI or MACD) can significantly improve your decision-making.
Remember, no indicator is 100% accurate. Market conditions change, and even the best setups can fail. That’s why risk management, patience, and consistency matter more than any single signal. Always use stop-losses, follow a favorable risk-reward ratio, and avoid emotional trading.
To effectively apply these strategies, using a reliable trading platform can help streamline chart analysis and execution. Platforms like Alice Blue ANT offer tools that support indicator-based trading, allowing you to test and refine your approach in real market conditions.
Frequently Asked Questions
A Golden Cross is a long-term signal, while a 70+ RSI is a short-term warning. In this scenario, you should wait for a “throwback.” Let the price break out, then wait for it to return and test the 50-day SMA as new support. Entering at RSI 70 often leads to getting stopped out by a minor correction before the actual move begins.
Indicators rely on high liquidity and “crowd psychology.” In large-cap stocks, millions of people (and algos) are watching the same 200 EMA. Small-cap or “penny‘ stocks are easily manipulated by a few large orders, which can “break” the indicator’s logic. For small-caps, prioritize volume over oscillators like RSI.
Indicators such as MACD and 50 EMA are far more reliable on daily or 4-hour charts. On a 1-minute chart, you will see dozens of “false” crossovers per hour. If you want to trade shorter timeframes, you must shorten your indicator periods (use a 9 EMA instead of a 20 EMA)
In a powerful downtrend, RSI can stay “oversold” (below 30) for weeks while the price crashes another 20-30%. The solution is to never buy just because the RSI is low. Wait for a bullish divergence or for the price to reclaim a moving average (like the 9 EMA) to prove that momentum is actually shifting back up.
For most retail traders, holding 3 to 5 positions is the “sweet spot.” It’s enough to spread risk, but few enough that you can closely monitor the news and price action for each.
Swing trades typically use daily charts as the primary time frame, with weekly charts for broader trend context. The recommended periods are 20/50 EMA, 14-period RSI, and 12/26/9 MACD, which are optimized for daily charts. Shorter intraday charts (5/15-min) suit quicker swings.
Most active Indian swing traders prefer EMA (especially 20 and 50-period) because it reacts faster to recent price changes and provides quicker entry/exit signals with less lag. SMA (particularly 50/200-day) is better for long-term trend confirmation and fewer false signals, such as Golden/Death Crosses on Nifty or Sensex. Many combine both: EMA for timing and SMA for overall bias.
Yes, the same indicators (especially, 20/50 EMA crossovers, MACD histogram flips, and Bollinger Band squeezes) work well on Nifty and bank Nifty for swing trades. The blog highlights their popularity for these indices on daily charts. Volume confirmation becomes even more important in derivatives due to high volatility.

Blog by Aliceblue News Desk


