Chart Patterns for Beginners: 7 Patterns to Learn First
Blog by Aliceblue News Desk
01 October 2026
11 minutes
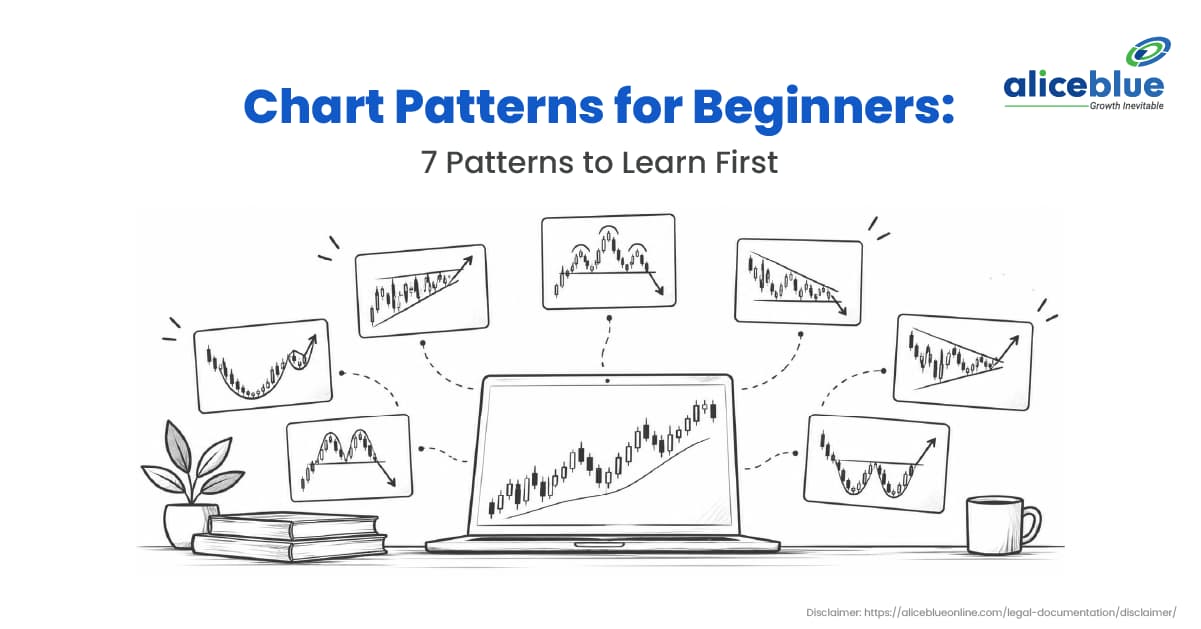
A share has failed to move above ₹500 three times. On the fourth attempt, it crosses ₹500. Has something changed, or will it fall back again?
A chart pattern helps you study that question. It shows where price has paused, turned or struggled before. It cannot tell you what will happen next. If you are learning to read stock charts, start with seven patterns: the rectangle, double top, double bottom, head and shoulders, ascending triangle, descending triangle, and flag.
Quick Answer
Chart patterns are shapes made by a stock’s price over time. Some may point to a change in an earlier rise or fall. Others show price pausing before its next move. To read a pattern, first look at what price was doing, then mark the level it needs to cross. Watch what happens at that level. A familiar shape on its own is not a reason to trade
Table of Contents
- What are chart patterns?
- How do you read a chart pattern?
- Which patterns should beginners learn?
- What does a rectangle look like in practice?
- What are the benefits and risks?
- How do reversal and continuation patterns differ?
- What mistakes should beginners avoid?
- Who should use chart patterns?
- Frequently asked questions
What Are Chart Patterns?
A chart pattern is a shape that appears as a share’s price rises, falls or moves sideways over a number of trading periods. Traders study these shapes to find price areas where the share has repeatedly turned or paused.
Suppose a share rises towards ₹500 several times and falls back each time. That tells you ₹500 has been difficult to cross. Traders call such an area resistance. If the share also stops falling near ₹480 several times, they call that area support. These are areas where price has reacted before, not walls that must always hold.
How Do You Read a Chart Pattern?
Before memorising names, practise these five steps on a chart.
- Look at the earlier move. Was the share rising, falling or moving sideways before the shape appeared? A possible change in direction only makes sense if there was an earlier move.
- Mark repeated highs and lows. In our example, price has turned near ₹480 and ₹500 more than once. Those areas give you something specific to watch.
- See what price does at a boundary. A share may move above ₹500 briefly and fall back. Crossing a level and staying beyond it are different things.
- Check trading volume. Volume is the number of shares traded. Compare it with recent sessions for context, but do not assume heavy trading means a move will continue.
- Consider what would change your view. If you were watching for price to move above ₹500, what would you think if it fell back into the old range? Ask that before risking money.
Which Patterns Should Beginners Learn?
Start with the rectangle because its upper and lower boundaries are relatively easy to see. Then learn the shapes that may suggest a change in direction, followed by those that form during a pause.
1. Rectangle
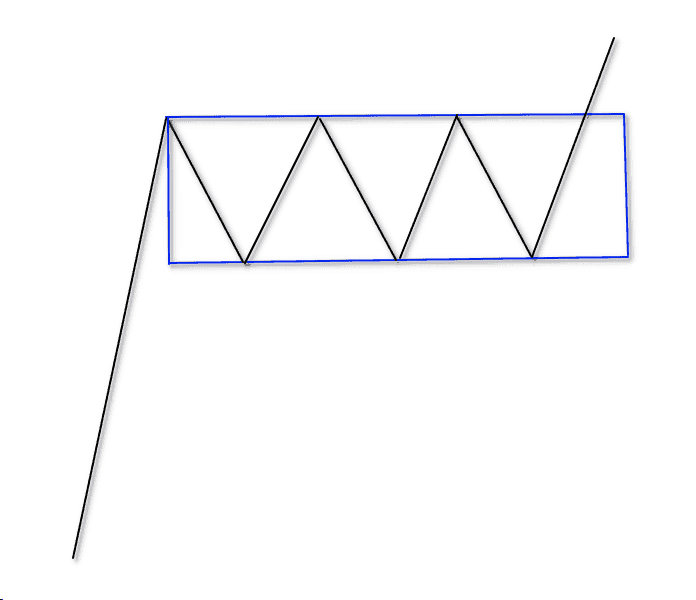
A rectangle forms when price moves between two areas several times. A share might recover near ₹480, rise towards ₹500, then fall back towards ₹480.
The important point is that the share can leave this range at either end. A move above ₹500 or below ₹480 is worth studying, but the rectangle does not tell you in advance which will happen.
2. Double top
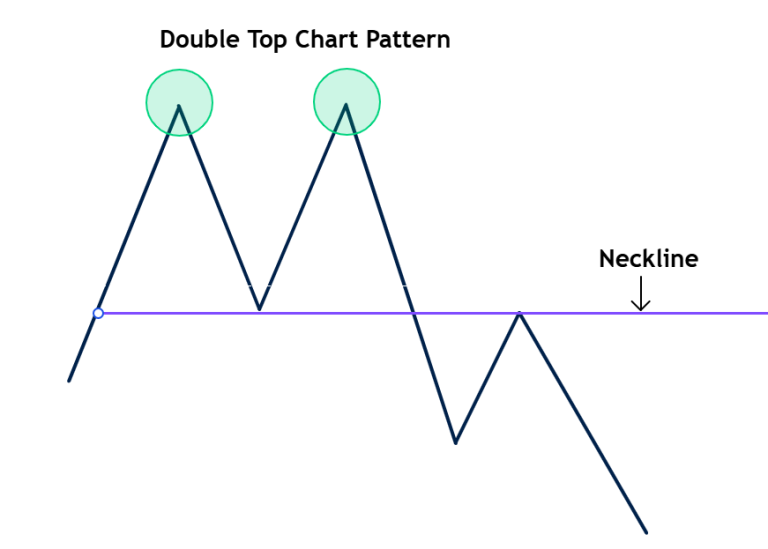
A double top looks like two hills at roughly the same height. It appears after a rise. Price reaches a high, falls, and later returns near that high before falling again.
The low between the two hills is the level traders watch. If price later falls below it, the earlier rise may be weakening. Two similar highs alone do not establish a change in direction.
3. Double bottom
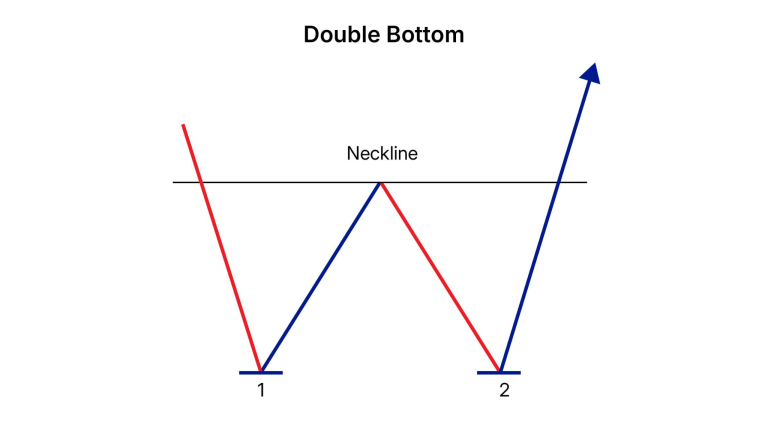
A double bottom looks like a W. After a fall, price reaches a low, recovers, falls near the same area again, and recovers once more.
This time, watch the high between the two lows. A move above it may suggest that buyers are gaining ground. The two lows do not need to match exactly to the rupee.
4. Head and shoulders
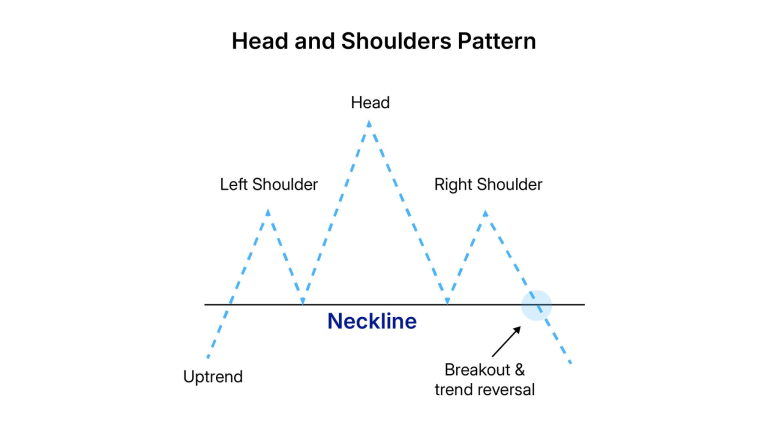
Picture three hills after a rise. The middle hill is the highest; the hills on either side are lower.
The line joining the two dips between the hills is called the neckline. Traders watch whether price falls below it. Until then, the shape is a possibility, not proof that the share has started a lasting fall.
5. Ascending triangle
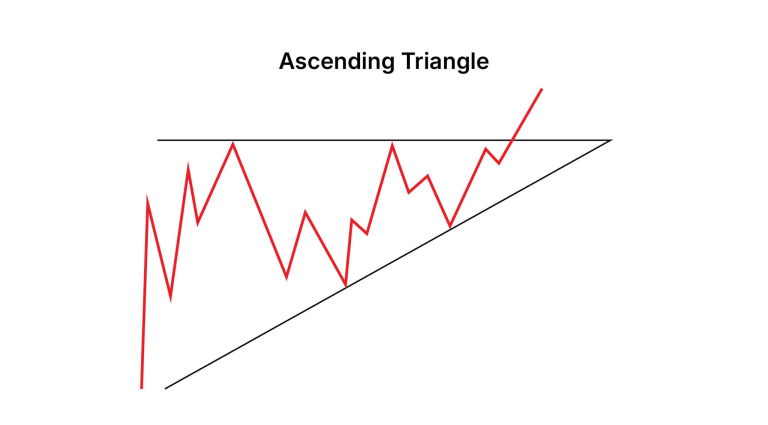
An ascending triangle has highs near the same price, while its lows gradually rise. For example, a share might approach ₹500 several times, but its pullbacks stop at ₹470, then ₹480, then ₹490.
Those higher lows show that the share has recovered sooner on each pullback. The area near ₹500 remains the price to watch. The triangle does not guarantee a move above it.
6. Descending triangle
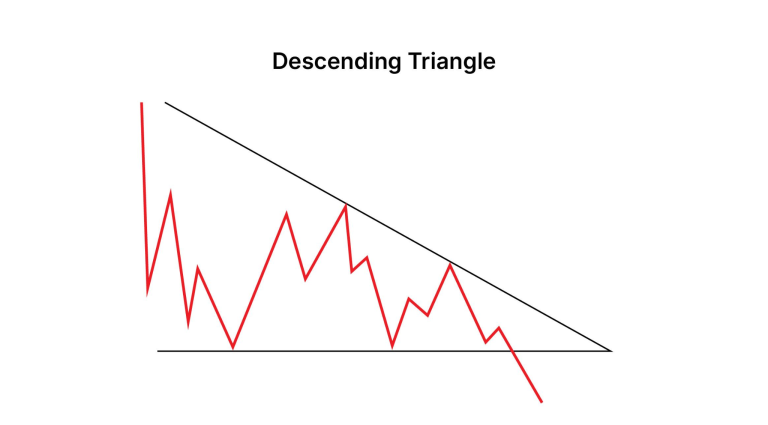
A descending triangle has lows near the same price, while each recovery stops at a lower high. Traders watch whether price moves below the repeated low.
It may not. The share could recover from that area again, so the move after the pattern matters more than its name.
7. Flag
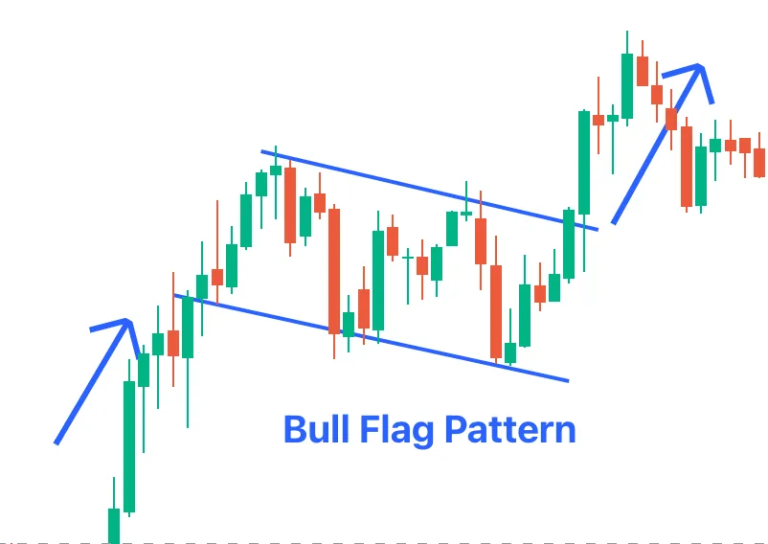
A flag begins with a strong rise or fall. Price then pauses or pulls back within a narrower area. Traders watch whether it leaves that area in the direction of the earlier move.
The move before the pause is important. Without it, a short stretch of sideways trading may not tell you much.
Pattern | What you see | Price area to watch |
Rectangle | Repeated moves between an upper and lower area | Either edge of the range |
Double top | Two highs after a rise | The low between the highs |
Double bottom | Two lows after a fall | The high between the lows |
Head and shoulders | Three peaks, with the middle peak highest | The line joining the dips |
Ascending triangle | Similar highs and rising lows | The upper edge |
Descending triangle | Similar lows and falling highs | The lower edge |
Flag | A strong move followed by a short pause | The edge of the pause |
What Does a Rectangle Look Like in Practice?
Consider a made-up example, not a particular share or a suggestion to trade. An NSE-listed share has moved between ₹480 and ₹500 for several weeks. The difference between those prices is ₹20.
One day, it closes above ₹500. A trader considers buying 100 shares at ₹505 and plans to sell if price falls to ₹495.
Part of the example | Calculation | Amount |
Cost of 100 shares | ₹505 × 100 | ₹50,500 |
Loss if sold at ₹495 | (₹505 − ₹495) × 100 | ₹1,000 |
Illustrative price based on the ₹20 range | ₹500 + ₹20 | ₹520 |
Gain if sold at ₹520 | (₹520 − ₹505) × 100 | ₹1,500 |
The ₹520 figure comes from adding the range’s height to its upper boundary. It is a way to examine the possible trade, not a price prediction. The figures also exclude brokerage, other charges, and taxes.
Now suppose the share crosses ₹500 but soon drops back into the old range. If the trader sells at ₹495, the loss is ₹1,000 before charges. If price moves quickly past ₹495, the actual sale price and loss could be different.
That is why the move after price crosses ₹500 matters. The shape helped the trader identify a level; it did not decide the outcome.
What Are the Benefits and Risks?
A pattern gives you a clearer question than “Does this share look good?” You can identify a price area, observe what happens there, and check later whether your reading held up. It can also help you think about a possible loss before entering a trade.
But patterns fail. Price may cross a level and turn back. News or a wider market move can change the picture quickly. Two people looking at the same chart may draw a boundary at slightly different prices.
There is a personal risk too. Once you have spotted a pattern, you may want to be right about it. If price moves against your reading, do not ignore the change or increase a position simply to defend your first idea.
How Do Reversal and Continuation Patterns Differ?
Type | What it suggests | Examples | What to check |
Reversal | An earlier rise or fall may be ending | Double top, double bottom, head and shoulders | Was there an earlier trend, and has price crossed the relevant level? |
Continuation | Price may resume an earlier move after a pause | Flag and some triangles | Was there a clear earlier move, and which way did price leave the pause? |
A rectangle does not fit neatly into either group while price remains inside it. A triangle also does not promise a move in one direction. Watch what the share actually does at the boundary rather than relying on a category name.
What Mistakes Should Beginners Avoid?
- Calling the pattern too early. Two highs may begin to resemble a double top, but price could still move above them. Watch the low between the highs.
- Forcing a shape onto the chart. If the highs and lows are unclear, move on. Not every share forms a pattern worth studying.
- Ignoring the earlier move. A flag needs a strong move before its pause. A possible reversal needs an earlier rise or fall.
- Treating a calculated level as a promised return. The ₹520 figure in the example is a calculation. The share may never reach it.
- Overlooking the possible loss. Think about how many shares you would hold and what a move against you could cost before placing a trade.
- Mistaking one candle for a larger pattern. A candle shows price movement over one chosen period.
Who Should Use Chart Patterns?
Chart patterns can be useful if you are willing to look at charts regularly, wait for a clear shape, and accept that your first reading may be wrong. Daily charts can give a beginner more time to study a move than fast intraday charts.
Long-term investors can use patterns to understand recent price behaviour. A chart shape should not replace research into the company or your reason for owning its shares.
You do not have to trade a pattern to learn from it. Save a chart, mark the area you are watching and return later to see what happened.
Conclusion
Start with a rectangle, double top and double bottom before trying to recognise every shape on a stock chart. Once you can spot those without forcing the lines, move on to triangles, flags and head and shoulders. Each pattern gives you a price area to watch, not a certain outcome. Look at the earlier move, see what happens at that area, and consider what would show that your reading was wrong. That is more useful than memorising a long list of names.
Frequently Asked Questions
A rectangle is a good starting point because its upper and lower price areas are relatively easy to see. It also teaches you that price can leave a range in either direction.
No. It means price has reached a similar high twice. Traders also watch the low between those highs to see whether the earlier rise may be weakening.
A candlestick pattern uses one candle or a small group of candles. A chart pattern describes a larger shape formed over more time.
It happens when price crosses a level but soon returns to its earlier range. A share might move above ₹500, for example, and then fall back below it.
The shapes can appear on intraday charts, but price changes faster and leaves less time to assess a move. Beginners may find daily charts easier to study first.
No. Volume tells you how many shares traded and adds context to the price move. It cannot tell you with certainty whether the move will continue.
Yes, to examine recent price behaviour or consider entry timing. A chart cannot tell you whether the company itself is a suitable long-term investment.

Blog by Aliceblue News Desk