
Elliott Wave Theory: Meaning, Patterns and How to Use It in Indian Markets
Blog by Aliceblue News Desk
15 October 2026
12 minutes
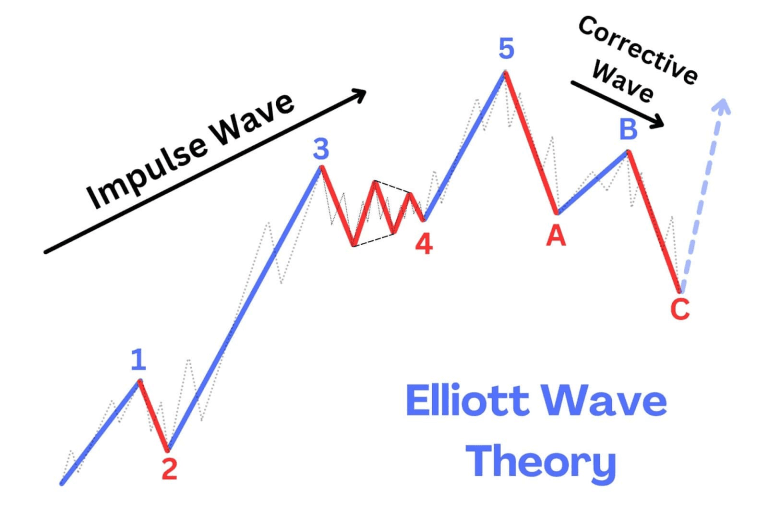
You have probably looked at a Nifty 50 chart and wondered why it rises in bursts, pulls back, and then rises again. Elliott Wave Theory tries to explain that rhythm. It says price moves in a repeating pattern of five waves with the trend, followed by three waves against it. This guide covers the Elliott wave pattern, its rules, a worked example with numbers, and the limits you should know before trading on it.
Table of Contents
- What Is Elliott Wave Theory
- How Does the Elliott Wave Pattern Work
- Practical Example With Numbers
- Key Features of Elliott Wave Theory
- Advantages
- Risks and Limitations
- Tips for Beginners
- How to Use Elliott Wave in a Trade
- Elliott Wave vs Dow Theory
- Common Mistakes to Avoid
- Who Should Use Elliott Wave Theory
- Conclusion
- FAQs
What Is Elliott Wave Theory
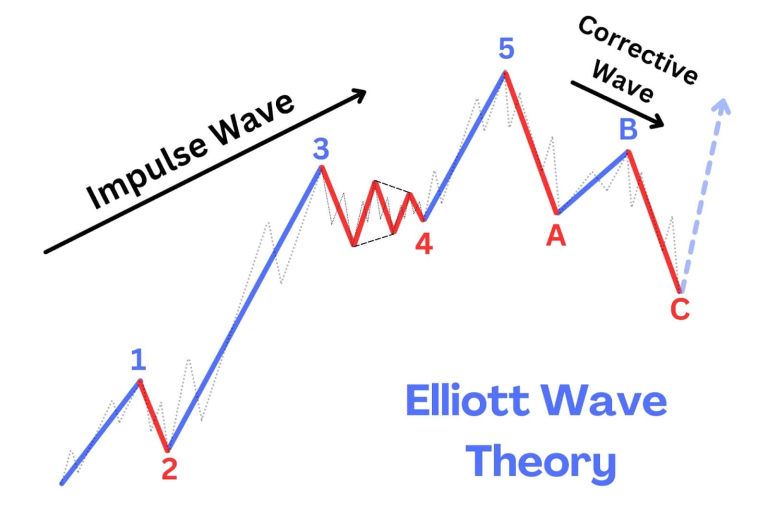
Elliott Wave Theory is a form of technical analysis that studies recurring price patterns to estimate where a market may go next. Ralph Nelson Elliott developed it in the 1930s. He believed prices move in repeating patterns because of shared investor psychology.
The idea is simple. When prices rise, optimism spreads slowly and then quickly. Then people get greedy, and later they get fearful. These mood swings show up on a chart as waves.
The theory works on any chart you can read: stocks, indices like Nifty and Bank Nifty, commodities, and currencies. It falls under technical analysis, which uses price and volume rather than company financials.
How Does the Elliott Wave Pattern Work
The pattern has two parts. Impulse waves move with the main trend and have five smaller waves. Corrective waves move against the trend and have three smaller waves.
Here is the sequence in an uptrend:
- Wave 1: A small group of buyers starts a new rise. Most people still think the old downtrend is on.
- Wave 2: Price falls back as early buyers book profit. It should not fall below the start of Wave 1.
- Wave 3: More traders join, and price rises past the Wave 1 high. This is usually the strongest and longest wave.
- Wave 4: Price pauses and falls again as profits are booked. It should not enter the price territory of Wave 1.
- Wave 5: The last push up, often with weaker momentum.
- Waves A to B to C: The trend then corrects. A is a fall, B is a partial bounce, and C is another fall. A full cycle has 8 waves.
The Three Core Rules
Elliott wave analysts treat these as fixed. If any rule breaks, the count is wrong, and you need to relabel it.
- Wave 2 never retraces more than 100 percent of Wave 1.
- Wave 3 is never the shortest among Waves 1, 3, and 5.
- Wave 4 does not overlap the price territory of Wave 1.
Where Fibonacci Fits In
Traders pair the waves with Fibonacci retracement levels to estimate where a pullback may end. Pullbacks often stop near 38.2 percent, 50 percent, or 61.8 percent of the previous move. A retracement of this kind is simply the percentage of the earlier rise that price gives back.
Fibonacci Ratios by Wave
Wave | Typical Fibonacci relationship |
Wave 2 | Retraces 50 percent to 78.6 percent of Wave 1 |
Wave 3 | Often reaches 161.8 percent of Wave 1 |
Wave 4 | Retraces 23.6 percent to 38.2 percent of Wave 3 |
Wave 5 | Often equals Wave 1, or 61.8 percent to 161.8 percent of the length from start of Wave 1 to top of Wave 3 |
Extensions and Truncation
In many impulses, one of the three motive waves (usually Wave 3) is extended, meaning it is much longer than the others. If Wave 3 is extended, Waves 1 and 5 tend to be about equal in length.
Truncation, or a truncated fifth, happens when Wave 5 fails to go beyond the end of Wave 3. This often occurs after a very strong Wave 3, or when sentiment shifts sharply against the trend.
Corrective Patterns: Zigzag, Flat and Triangle
- Zigzag: A sharp correction in three waves (A to B to C). A and C are impulse-like moves; B is a smaller pullback. It often retraces 50 percent to 61.8 percent of the previous impulse.
- Flat: A slower, sideways correction, also A to B to C. Wave B ends near the start of Wave A, and Wave C ends near the end of Wave A. In an expanded flat, B goes beyond the start, and C goes beyond the end. Flats often retrace around 38.2 percent to 50 percent.
- Triangle: A tight sideways pattern with five waves (A to B to C to D to E). Each wave is small and overlaps the previous one. Triangles usually retrace only 23.6 percent to 38.2 percent and often appear before a strong breakout.
Practical Example With Numbers
The numbers below are made up to show the method. They are not a real Nifty 50 record or a trade recommendation.
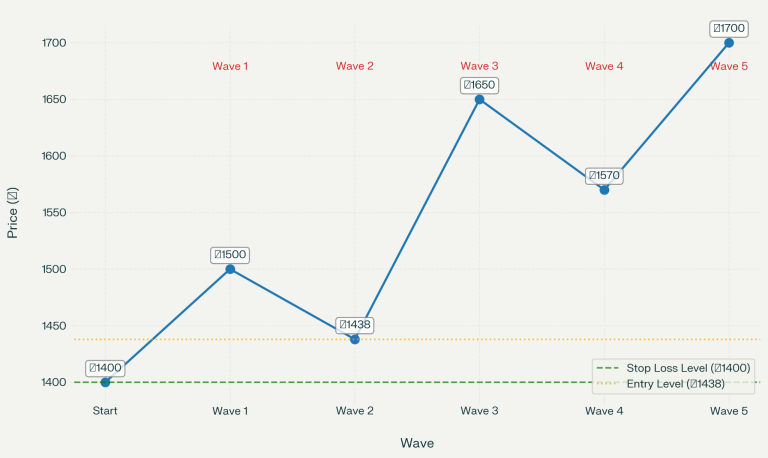
Say a stock like Infosys moves like this:
Wave | Move | Price in rupees | Size in rupees |
Start | Low | 1400 | – |
Wave 1 | Up | 1500 | 100 |
Wave 2 | Down | 1438 | 62 (62 percent of Wave 1) |
Wave 3 | Up | 1650 | 212 |
Wave 4 | Down | 1570 | 80 |
Wave 5 | Up | 1700 | 130 |
Check the rules. Wave 2 held above 1400, so it passed. Wave 3 (212) is longer than Wave 1 (100) and Wave 5 (130), so it passed. Wave 4 low (1570) stayed above the Wave 1 high (1500), so there was no overlap.
Now the trade idea. A trader who waits for the Wave 2 pullback might buy near 1438, just above the 61.8 percent level (a 61.8 percent pullback of Wave 1, which is 100, takes price to about 1438). They place a stop loss at 1400, a risk of 38 per share. If Wave 3 reaches 1650, the gain is 212 per share, a reward-to-risk ratio of about 5.6 to 1. For every 1 rupee at risk, the example aims for about 5.60 rupees.
For 100 shares, the risk is 3800 rupees and the potential gain is 21200 rupees. If the price breaks 1400 instead, the count is invalid, and the stop loss limits the loss. Costs like brokerage and taxes will reduce both numbers.
After Wave 5 at 1700, a three-wave correction may follow. A trader holding the stock may then tighten the stop or book profit.
Key Features of Elliott Wave Theory
- Five up, three down: Every complete cycle has 8 waves.
- Waves inside waves: Each big wave is made of smaller waves that look similar. The degrees range from Grand Supercycle (can last decades) to Minuette (minutes or hours).
- Fixed rules, flexible guidelines: Rules cannot be broken. Guidelines, such as Fibonacci ratios and alternation between Wave 2 and Wave 4, are only tendencies.
- Works on any timeframe: You can apply it to a 5-minute chart or a weekly chart.
- Psychology based: The waves reflect fear, hope and greed among market participants.
Wave Degrees (Timeframes)
Degree | Typical timeframe |
Grand Supercycle | Decades |
Supercycle | Many years |
Cycle | One to several years |
Primary | Months to a year |
Intermediate | Weeks to months |
Minor | Days to weeks |
Minute | Hours to days |
Minuette | Minutes to hours |
Advantages
- It gives a map of where a trend may be in its life, so you do not chase a move at its end.
- It gives clear points where your count is proven wrong. If Wave 2 breaks below the Wave 1 start, you exit. This helps with risk control.
- It helps in setting targets, for example by comparing Wave 5 to Wave 1.
- It works with other tools like moving averages, RSI, and support and resistance, which can confirm a count.
- It can be used across timeframes, so it suits both swing traders and positional traders.
Risks and Limitations
The biggest problem is subjectivity. Two analysts can count the same chart differently, and both can sound convincing. A count that looks right today can be relabelled tomorrow after new candles form.
There are also behavioural risks. Traders often force a pattern onto the chart because they want a certain outcome. This is seeing only what you want to see on the chart. Others hold on to a losing trade because it is only Wave 4 and refuse to accept the stop loss.
On the financial side, trading in futures and options with leverage can turn a wrong count into a large loss quickly. Learning the theory also takes time, since real charts are rarely as clean as textbook diagrams.
Be careful in sideways, low-volume stocks where patterns are unclear.
Tips for Beginners
- Start on daily and weekly charts of liquid names like Nifty 50, Reliance or HDFC Bank. Short timeframes are noisier.
- Learn the three rules before anything else. Mark them on every chart.
- Wait for Waves 1 and 2 to finish before taking a position, rather than guessing the start.
- Always place a stop loss at the price where your count is proven wrong.
- Risk only 1 to 2 percent of your capital on one trade.
- Confirm with volume, RSI, or moving averages.
- Practise on past charts first, then paper trade, then trade small.
- Keep an alternate count in mind. If price breaks your invalidation level, accept it.
You can chart and practise on the Alice Blue trading platform after you open a demat account.
How to Use Elliott Wave in a Trade
- Check the trend on a daily chart (Nifty, Bank Nifty, or a liquid stock).
- Mark a clear five-wave move (1 to 2 to 3 to 4 to 5) that follows the three rules.
- Use Fibonacci to see if Wave 2 and Wave 4 ended near common levels (50 to 78.6 percent for Wave 2, 23.6 to 38.2 percent for Wave 4).
- Plan your entry after Wave 4, with a stop below the Wave 4 low or below the Wave 1 high (depending on your count).
- Set a target near the end of Wave 5, and be ready to exit if the count breaks.
Elliott Wave vs Dow Theory
Parameter | Elliott Wave Theory | Dow Theory |
Core idea | Prices move in 5- to 3-wave cycles | Market has primary, secondary, and minor trends |
Focus | Pattern counting and targets | Trend confirmation across indices |
Subjectivity | High | Lower |
Best for | Timing entries, exits and targets | Identifying the broader trend |
Learning curve | Steep | Moderate |
Tools used | Fibonacci, wave rules | Volume, index confirmation |
Many traders use Dow Theory to identify the direction and Elliott Wave to time the entry.
Common Mistakes to Avoid
- Forcing a count: If the chart is unclear, skip it. Find a cleaner one. Why it is a problem: You end up trading a pattern that is not really there. What to do instead: Wait for a clear 5 to 3 structure and mark the rules on the chart.
- Ignoring the rules: A Wave 4 overlapping Wave 1 means your count is wrong. Why it is a problem: Your whole map is off, so your targets and stops are unreliable. What to do instead: Relabel the waves or step aside.
- Trading without a stop loss: Waves can extend. Why it is a problem: A wrong count can lead to a large loss. What to do instead: Place a stop at the level that cancels your count before you enter.
- Using it alone: Combine it with volume and other indicators. Why it is a problem: A count can look perfect and still fail. What to do instead: Look for confirmation from RSI, moving averages, or support and resistance.
- Starting with intraday charts: Small waves are hard to read. Why it is a problem: Noise leads to frequent relabelling and frustration. What to do instead: Begin with daily charts, then move to lower timeframes.
- Expecting exact targets: Targets are zones, not guarantees. Why it is a problem: Price may reverse before your target or overshoot it. What to do instead: Treat targets as areas and watch price action.
Who Should Use Elliott Wave Theory
It suits swing traders and positional traders who are comfortable studying charts and can wait for setups. Technical analysts who like Fibonacci levels will also find it useful, and long-term investors can use it to see whether the market may be late in a cycle.
It is less suitable for complete beginners who want quick signals, and for people who cannot spend time learning chart patterns. If you prefer rule-based, mechanical systems, the subjectivity may frustrate you.
Conclusion
Elliott Wave Theory describes market trends as five waves with the trend and three against it, driven by crowd psychology. It gives structure for entries, targets, and stop-loss levels, but wave counting is subjective and can mislead. Learn the three rules, practise on higher timeframes, confirm counts with other indicators, and keep your risk small. Treat it as one tool among several, not a prediction method. No single tool tells you what price will do next. Always use a stop loss and keep your position size small.
Frequently Asked Questions
It says market prices move in repeating waves: five in the direction of the trend and three against it. These waves reflect changing investor emotions.
No method is fully accurate. Counts are subjective, so analysts often disagree. It works better when combined with other indicators and strict stop losses.
Waves 1, 3, and 5 move with the trend, and Waves 2 and 4 are pullbacks. Wave 3 is usually the strongest.
Wave 2 cannot retrace more than 100 percent of Wave 1. Wave 3 cannot be the shortest of the three impulse waves. Wave 4 cannot overlap Wave 1.
It is learnable, but harder than basic tools like support and resistance. Start with the rules and higher timeframes, and practise before using real money.
Yes, it works on any timeframe. Intraday waves are noisier and need quick decisions, so beginners are better off on daily charts.
Fibonacci retracement is the most common pairing. RSI, volume, and moving averages help confirm a count.
Wave 3 is usually the longest and strongest, with strong volume and momentum. Wave 5 often shows weaker momentum and may fail to extend far beyond Wave 3.

Blog by Aliceblue News Desk


