Flag Pattern: Meaning, Types, Formation and Trading Strategy
Blog by Aliceblue News Desk
26 October 2026
12 minutes
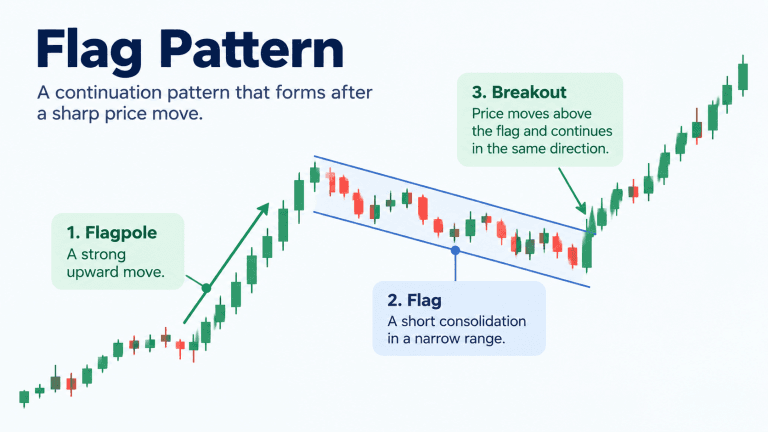
Markets rarely move in a straight line. A stock may rise sharply, pause for a few sessions, and then continue higher. It can also fall quickly, recover slightly, and then resume its decline. One chart formation traders use to study these pauses is the flag pattern.
The shape alone is not enough. A proper flag needs a clear prior move, a relatively short consolidation, and a breakout before the pattern can be treated as complete. Flag patterns fall under technical analysis, which SEBI describes as the study of price movements, trends, patterns, and trading volumes. Readers who are new to chart-based analysis can refer to SEBI’s Technical Analysis vs Fundamental Analysis guide for the broader regulatory education context.
Quick Answer
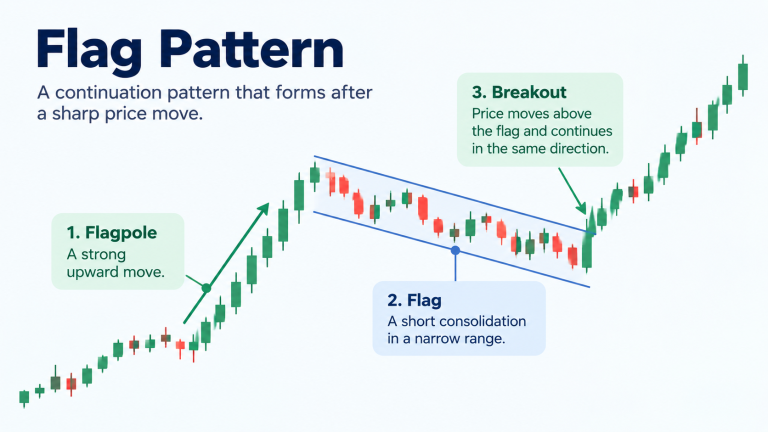
A flag pattern is a continuation chart pattern that forms after a sharp upward or downward move. The first strong move creates the flagpole, while the following narrow consolidation forms the flag. A bullish flag usually pauses or drifts slightly lower before an upward breakout. A bearish flag usually pauses or moves slightly higher before a downward breakout.
The breakout confirms that price has left the flag in the expected direction, but it does not guarantee that the move will continue.
Table of Contents
- What Is a Flag Pattern?
- How Does a Flag Pattern Form?
- Bull Flag Pattern
- Bear Flag Pattern
- Bull Flag vs Bear Flag
- How to Identify a Flag Pattern
- How Traders Use a Flag Pattern
- Flag Pattern Target
- Flag Pattern vs Pennant
- Practical Example
- Role of Volume
- Failed Flag Pattern
- Common Mistakes
- Limitations
- Tips for Beginners
- Conclusion
- FAQs
What Is a Flag Pattern?
A flag pattern is generally treated as a continuation chart pattern. It appears when a strong price move pauses for a relatively short period before price attempts to continue in the same direction.
The pattern gets its name from its appearance. The sharp move looks like a flagpole, while the consolidation resembles a small flag attached to it.
A flag should not be confused with any normal sideways range. The pattern usually needs a clear and sharp move before the consolidation. Without that flagpole, the formation may simply be a rectangle or price channel.
Alice Blue’s guide to 10 Stock Chart Patterns Every Beginner Should Know explains the flag alongside other continuation and reversal patterns, which can help beginners understand how it differs from triangles, rectangles, double tops, and other common formations.
For example, suppose a stock rises quickly from ₹500 to ₹580 and then spends a few sessions moving between ₹560 and ₹575. That narrow consolidation may form a bullish flag. If price later breaks above the upper boundary, the continuation setup has more confirmation.
How Does a Flag Pattern Form?
A flag pattern usually has three parts:
1. Flagpole:
The flagpole is the sharp price movement before consolidation. In a bullish flag, this is a strong upward move. In a bearish flag, it is a sharp decline.
2. Flag:
After the strong move, price pauses and trades inside a relatively narrow channel. The two boundaries are usually close to parallel. In a bullish flag, the channel often slopes slightly downward or moves sideways. In a bearish flag, it often slopes slightly upward or sideways. The consolidation should normally be smaller and calmer than the flagpole.
3. Breakout:
The breakout occurs when price leaves the flag. For a bullish flag, traders generally watch for a move above the upper boundary. For a bearish flag, they watch for a move below the lower boundary.
The breakout confirms that price has left the pattern in the expected direction, but traders still need to see whether price actually follows through.
What Is a Bull Flag Pattern?
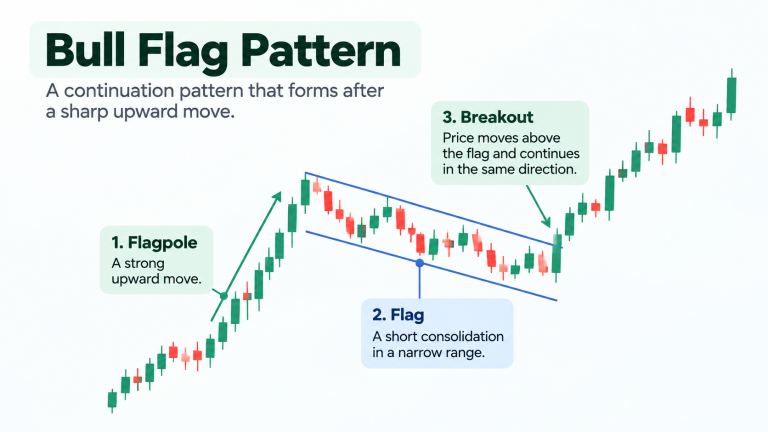
A bull flag pattern forms after a sharp upward move.
Price rises quickly, creating the flagpole, and then pauses or pulls back inside a narrow channel. This pullback is usually much smaller than the earlier rally.
Suppose a stock rises from ₹1,000 to ₹1,120 and then moves between ₹1,075 and ₹1,110 for several sessions. If price later breaks above the upper boundary of that consolidation, traders may interpret it as a bullish continuation setup.
The flag itself often slopes slightly downward because price is temporarily giving back part of the earlier move.
What Is a Bear Flag Pattern?
A bear flag pattern forms after a sharp downward move.
Price falls quickly, forming the flagpole, and then pauses or rebounds slightly inside a narrow channel.
For example, suppose a stock falls from ₹800 to ₹700 and then recovers gradually toward ₹730. If this recovery remains inside a small upward-sloping channel and price later breaks below the lower boundary, traders may treat it as a bearish continuation setup.
The temporary rise inside the flag should not be confused with a confirmed reversal. The larger context still depends on the earlier sharp decline.
Bull Flag vs Bear Flag
Feature | Bull Flag | Bear Flag |
Previous move | Sharp rise | Sharp fall |
Flagpole direction | Up | Down |
Flag direction | Usually sideways or slightly down | Usually sideways or slightly up |
Expected breakout | Above flag | Below flag |
General interpretation | Possible continuation higher | Possible continuation lower |
Pattern confirmed? | After upward breakout | After downward breakdown |
The flag usually moves against the direction of the earlier strong move or stays relatively flat. If the consolidation itself becomes a strong move in the opposite direction, the flag setup becomes weaker.
How to Identify a Flag Pattern?
A good flag setup usually has several features:
- A clear flagpole: There should be a strong directional move before the flag forms.
- Short consolidation: The flag should be relatively small compared with the flagpole.
- Parallel boundaries: The upper and lower trendlines should be roughly parallel.
- Counter-trend or sideways drift: A bullish flag often drifts lower, while a bearish flag often drifts higher.
- Breakout in the original direction: Traders usually wait for price to leave the flag before treating the setup as complete.
- Volume context: Volume may become quieter during consolidation and increase again around the breakout.
A small channel without a strong prior move is usually not enough to call the pattern a flag.
How Do Traders Use a Flag Pattern?
The most common approach is to wait for the breakout instead of entering simply because the flag shape has appeared.
In a bull flag, traders may watch for price to break above the upper boundary. In a bear flag, they may watch for a break below the lower boundary.
These boundaries behave much like short-term support and resistance areas. Instead of treating them as exact prices, traders generally watch how price behaves around the zone. Alice Blue’s guide to Support and Resistance Trading in India explains why such levels are better treated as areas where price has reacted rather than fixed walls.
Some traders also wait for a retest. For example, after a bullish breakout, price may return toward the broken upper trendline. If that area holds and price starts rising again, the setup may have additional confirmation.
The invalidation point should also be clear. If price moves strongly through the opposite side of the flag, the original continuation idea may no longer make sense.
How Is the Flag Pattern Target Calculated?
A common theoretical target uses the length of the flagpole.
Suppose a bullish flag begins with a rise from ₹500 to ₹580.
Flagpole length = ₹580 – ₹500 = ₹80
If the breakout happens around ₹570:
Theoretical target = ₹570 + ₹80 = ₹650
For a bearish flag, traders may subtract the flagpole length from the breakdown point.
This is a measured-move reference, not a prediction. Price may stop before the target, move beyond it, or fail immediately after the breakout.
The measured target should also not determine the stop-loss. The stop should be based on the point at which the original trade idea no longer makes sense.
Flag Pattern vs Pennant Pattern
Flags and pennants are both continuation patterns, but their consolidation shapes are different.
A flag usually forms between roughly parallel trendlines, creating a rectangular or channel-like shape.
A pennant has converging trendlines, producing a small triangular shape.
Feature | Flag | Pennant |
Consolidation shape | Rectangle or channel | Small triangle |
Trendlines | Roughly parallel | Converging |
Sharp move before pattern | Usually | Usually |
General interpretation | Continuation | Continuation |
The sharp move before the consolidation matters in both cases. Without it, the shape may belong to a different chart pattern.
Practical Flag Pattern Example
Suppose a stock rises sharply from ₹200 to ₹250. This ₹50 rise forms the flagpole.
Price then spends several sessions moving between ₹235 and ₹245. The consolidation is small compared with the earlier move and slopes slightly downward.
A trader draws two roughly parallel lines around the consolidation.
Price later closes above ₹245 and volume improves.
The setup now has the main characteristics of a bullish flag: a strong prior rise, controlled pullback, roughly parallel boundaries, and a breakout in the earlier trend direction.
Using the measured-move method:
₹245 + ₹50 = ₹295
₹295 is only a theoretical reference. The trader still needs to decide where the pattern becomes invalid and whether the possible reward justifies the amount being risked.
What Role Does Volume Play?
Volume can provide useful context during a flag pattern.
The flagpole often forms with stronger trading activity because price is moving sharply. During the flag itself, volume may become quieter as the market consolidates.
If volume increases again when price breaks out, traders may view that as stronger participation behind the move.
However, volume should not be treated as proof that the breakout will continue. A breakout can still fail even when trading activity increases.
What Does a Failed Flag Pattern Look Like?
A flag does not always continue in the expected direction.
A bullish flag may break above the upper boundary but quickly fall back inside the range. This is commonly called a false breakout.
The setup can also fail before the breakout. If the consolidation becomes too deep, lasts too long, or price moves strongly through the opposite side of the flag, the original continuation idea may no longer be valid.
A failed pattern is useful information because it shows that the expected continuation did not develop. Traders should not keep treating the formation as a valid flag simply because it originally looked like one.
Common Mistakes When Trading Flag Patterns
- Seeing a flag in every consolidation: Without a strong flagpole, a small channel may simply be a range.
- Entering before the breakout: The pattern can fail while it is still forming.
- Ignoring the size of the pullback: A deep reversal can weaken the continuation setup.
- Confusing a flag with a pennant: Flags have roughly parallel trendlines, while pennants have converging lines.
- Assuming every breakout will continue: Price can break out and quickly return inside the pattern.
- Treating the target as guaranteed: The flagpole projection is only a reference.
- Ignoring volume completely: Volume can add context during the flagpole, consolidation, and breakout.
- Chasing price after a large breakout: A late entry can increase the amount at risk while reducing the potential reward.
- Forgetting the invalidation point: Traders should know where the setup no longer makes sense before entering.
Limitations of the Flag Pattern
- False breakouts can occur: Price may move outside the flag and quickly reverse.
- Pattern drawing is subjective: Different traders may draw slightly different boundaries.
- Continuation is not guaranteed: A flag describes historical price behaviour, not future certainty.
- Volume may not follow the textbook pattern: Real markets are often less clean than textbook examples.
- News can override the setup: Earnings, corporate announcements, or wider market events can invalidate the pattern quickly.
- The measured target may not be reached: Price can stop before it or move beyond it.
- Low-liquidity stocks may create misleading patterns: Thin trading can produce chart shapes that look cleaner than they really are.
A recognisable chart pattern does not remove market, liquidity, or volatility risk. SEBI advises investors to understand their investment objectives and risk appetite before participating in securities markets. Its guide to key risks in the securities market explains market, liquidity, volatility, and other risks that can affect an investment or trade.
Tips for Beginners
- Find the flagpole first, then look for the flag.
- Make sure the consolidation is smaller than the initial move.
- Use roughly parallel lines to define the flag.
- Wait for a breakout instead of assuming the pattern will complete.
- Look at volume for additional context.
- Treat the breakout level as an area rather than one exact price.
- Decide where the pattern becomes invalid before entering.
- Use the measured move as a guide, not a fixed target.
- Practise identifying flags on historical charts before using them live.
Conclusion
The flag pattern is a continuation chart formation that usually appears after a strong price move followed by a short consolidation.
A bullish flag forms after a sharp rise and may continue higher after an upward breakout. A bearish flag forms after a sharp decline and may continue lower after a downward breakout.
The most important parts are the flagpole, the controlled consolidation, and the breakout in the direction of the earlier move.
The pattern is useful because it helps traders organise price behaviour, but it does not predict the future. Volume, breakout confirmation, invalidation, and risk management still matter.
Frequently Asked Questions
A flag pattern is a continuation chart pattern that forms after a sharp price move followed by a short consolidation between roughly parallel boundaries.
A bull flag forms after a strong upward move. Price then pauses or pulls back before potentially breaking upward.
A bear flag forms after a sharp decline. Price temporarily consolidates or rebounds before potentially breaking lower.
Traders generally wait for price to break out of the flag in the direction of the original flagpole. Volume can provide additional context, but it does not guarantee continuation.
A common method is to measure the flagpole and project that distance from the breakout point. This is only a theoretical target.

Blog by Aliceblue News Desk