
How to Analyse a Mutual Fund Before Investing: Ratios, Returns & Red Flags
Blog by Aliceblue News Desk
15 April 2026
7 minutes
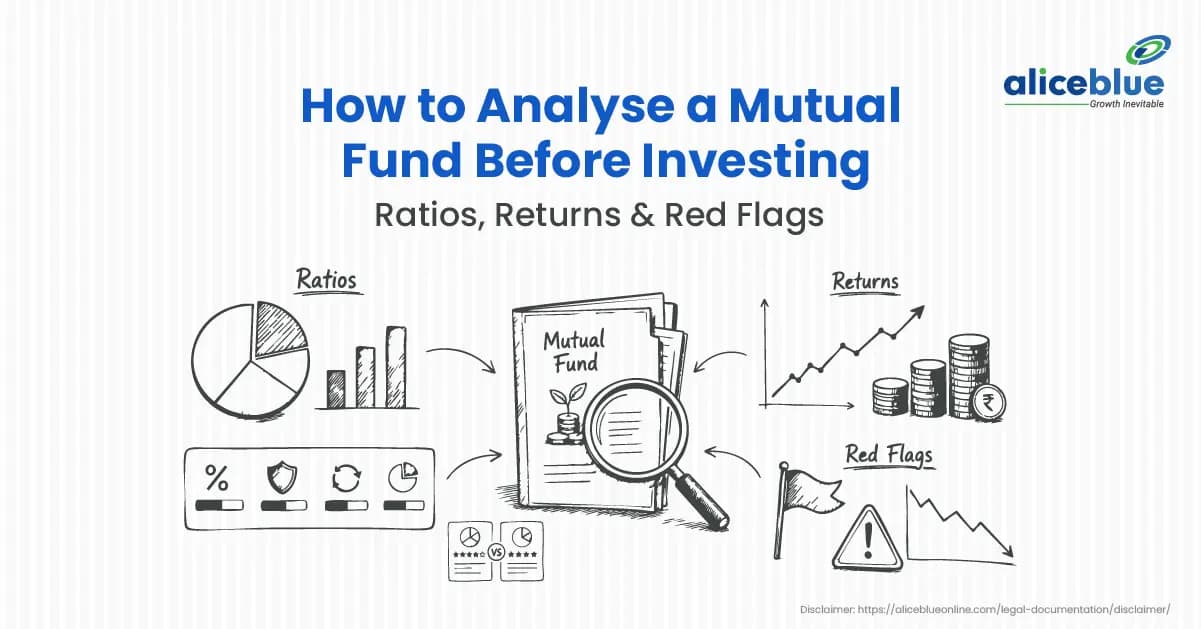
Most people choose a mutual fund after seeing a high recent return and thinking, “This looks safe enough.” The problem is that a fund can look like a winner because it caught a short market trend, took extra risk, or held a concentrated set of stocks that worked for a while. That’s exactly why learning how to analyse a mutual fund before investing matters.
In this guide, you’ll learn what mutual funds are, which returns and ratios actually help, and the red flags that can save you from investing in a fund that looks good today but may disappoint later.
What is “How to Analyse a Mutual Fund Before Investing: Ratios, Returns & Red Flags”?
It means evaluating a mutual fund using three lenses:
- Returns: How the fund performed over meaningful time periods (not just the last year).
- Ratios (risk and risk-adjusted performance): Whether returns came with sensible risk or a very bumpy ride.
Red flags: Patterns that often appear before long-term underperformance.
What are mutual funds?
A mutual fund pools money from many investors and invests it in a basket of assets (shares, bonds, or both). The portfolio is run either by a fund manager (active fund) or by a fixed rule that tracks an index (index fund).
Why people use mutual funds:
- Diversification: One investment gives exposure to many securities
- Small-ticket investing: SIPs make it easy to invest monthly
- Goal-based choices: Different categories suit different time horizons and risk levels
Step-by-Step Process to Analyse a Mutual Fund Before Investing
Step 1: Start with your goal
Before checking numbers, fix these:
- Time horizon: 1–3 years vs 5+ years changes what categories make sense
- Goal: wealth creation, short-term parking, tax-saving, etc.
- Risk comfort: can you stay invested during a 20-30% fall in equity markets?
Note: Only compare funds within the same category. Comparing a mid-cap fund to a large-cap fund is a common mistake.
Step 2: Check returns the right way
Use returns in this order:
- 5-year and 10-year annualised returns (if available): Best for long-term investors, as they cover multiple market phases.
- 3-year returns: Useful, but can still reflect one market style doing well.
- Rolling returns (best for consistency): Rather than one 3-year number, rolling returns track results across 3-year periods starting on different dates, reducing “lucky start date” bias.
Also compare returns against:
- Benchmark: the index the fund is measured against
- Category peers: similar funds in the same bucket
A key India-specific point: In India, mutual funds must benchmark and disclose performance using the Total Return Index (TRI) version of an index (which includes dividends), making comparisons fairer than using price-only indices.
Step 3: Use a few ratios to judge return quality
1) Standard Deviation (Volatility)
Shows how widely returns swing around the average. Higher volatility = more ups and downs.
2) Sharpe Ratio
Shows return earned per unit of risk (volatility). When comparing similar funds, a higher Sharpe usually indicates better risk-adjusted performance.
3) Beta
Shows how sensitive the fund is to its benchmark.
- ~1: moves similar to benchmark
- 1: tends to swing more
- <1: tends to swing less
4) Alpha (mainly for active equity funds)
Shows whether the fund delivered extra return beyond what its risk level would suggest. Alpha matters more when it stays positive over long periods, not just one year.
Step 4: Check cost and portfolio behaviour
Expense ratio: A long-term return drag that many investors ignore. If two funds are similar, lower cost often wins over time.
Direct vs Regular plan: Direct plans usually have lower expense ratios than regular plans because distributor commission isn’t included.
Portfolio turnover: High turnover means frequent buying/selling. It’s not automatically bad, but high turnover + inconsistent results is a warning sign.
Step 5: Look inside the portfolio
Check the fund’s factsheet/portfolio disclosure for:
- Top holdings concentration: If the top 10 holdings form a large chunk, one wrong bet can hurt.
- Sector tilt: Heavy exposure to one sector increases “sector cycle” risk.
- Style drift: A fund that slowly changes its behaviour (example: “large cap” acting like mid-cap) changes your risk without you noticing.
Example
You shortlist two flexi-cap funds for a 7+ year goal.
- Fund A: Slightly lower 5-year return, but better rolling return consistency, lower volatility, and a higher Sharpe ratio.
- Fund B: Slightly higher 5-year return, but much higher volatility and weaker rolling consistency.
Even though Fund B looks better on one headline number, Fund A looks more dependable because it has performed well across more time windows and has handled risk better.
Takeaway: For long-term goals, don’t choose a fund only because it tops a 1-3 year return list.
Key Checks (Returns + Ratios) You Should Use
Before you invest, run a quick check on returns, risk, cost, and concentration. This table tells you what each metric means and what to treat as a warning sign.
What to Check | What does it tell you | Good sign | Watch out for |
5Y/10Y annualised return | Long-term ability | Stronger over a longer period | Great 1Y, weak 5Y/10Y |
Benchmark (TRI) vs fund | Whether the fund beat its yardstick | Beats benchmark over time | Trails benchmark for years |
Rolling returns | Consistency across periods | Many windows show steady performance | Performance depends on one short phase |
Standard deviation | Volatility | Reasonable for the category | Much higher than peers |
Sharpe ratio | Risk-adjusted return | Higher than category peers | Lower Sharpe despite similar returns |
Expense ratio | Cost drag | Lower for similar funds | High cost without consistency |
Concentration (top holdings/sector) | Hidden risk | Balanced exposure | Heavy reliance on a few holdings |
Risks or Limitations
No analysis can guarantee future returns. What it can do is help you avoid funds that fail for predictable reasons.
Red flags to take seriously
- Only short-term outperformance: Great 1-year/2-year numbers but average or weak 5-year record
- Unstable rolling returns: Looks good only in a few windows, weak in most
- High volatility without payoff: Big swings but no better long-term returns
- Over-concentration: Too much in the top 5–10 holdings or one sector
- Style drift: Fund behaves differently from its category for long periods
- High cost + no edge: Higher expense ratio but no consistent risk-adjusted benefit
- Frequent manager/strategy changes: Not always bad, but repeated changes reduce predictability
Note: Also, remember that every scheme must display a Riskometer showing its risk level (low to very high). Use it as a quick first filter before going deeper.
Trailing Returns vs Rolling Returns
Feature | Trailing Returns | Rolling Returns |
Meaning | Return from one fixed start date to today | Returns across many time windows |
Best use | Quick snapshot | Consistency check |
Main weakness | Can look great due to a lucky start date | Needs more data/tools |
Use it like | “How did it do from then to now?” | “How often did it do well?” |
If you’re stuck between two funds, rolling returns usually give the clearer answer because they reduce start-date bias.
Common Mistakes Beginners Make
- Buying the top recent performer without checking longer periods
- Comparing funds from different categories and assuming a higher return = better
- Ignoring risk and later panicking during drawdowns
- Skipping portfolio checks (concentration, sector tilt, drift)
- Paying higher costs without getting consistent risk-adjusted results
- Holding too many funds in the same category (overlap without benefit)
Conclusion
Lorem ipsum dolor sit amet, consectetur adipiscing elit. Ut elit tellus, luctus nec ullamcorper mattis, pulvinar dapibus leo.
FAQs
Start with the goal and time horizon, then pick the right category. After that, check 5Y/10Y returns (if available), benchmark (TRI) comparison, rolling returns consistency, and expense ratio. TRI benchmarking (dividends included) makes performance comparison more accurate than price-only indices.
For long-term investing, 5-year and 10-year periods matter more because they cover different market phases. A year is the least dependable for choosing a fund. Use 3-year returns as support, but don’t rely on them alone.
Rolling returns measure performance across many overlapping windows (example: every 3 years). This shows consistency and reduces the chance of selecting a fund that looks good only because of one lucky start date.
There’s no fixed “best” number. Use Sharpe to compare funds within the same category and the same time period. If two funds have similar returns, the one with the higher Sharpe generally handles risk better.
Not always, but it raises the bar. A higher-cost fund should show consistent long-term performance and better risk-adjusted numbers to justify the extra cost. If two funds are similar, lower cost often wins. Direct plans usually have lower expense ratios than regular plans.
Look for a weak long-term record, inconsistent rolling returns, high volatility without better returns, heavy concentration, style drift, and high cost without an edge. Rolling returns are one of the fastest consistency checks.
Often, 2 to 4 funds are enough, depending on goals (example: one equity fund for growth, one debt fund for stability, and maybe one hybrid/goal-specific fund). Too many funds usually create overlap and make tracking harder.

Blog by Aliceblue News Desk


