
KPI in IPO Prospectus: How to Read the Numbers Before You Invest
Blog by Aliceblue News Desk
20 May 2026
14 minutes
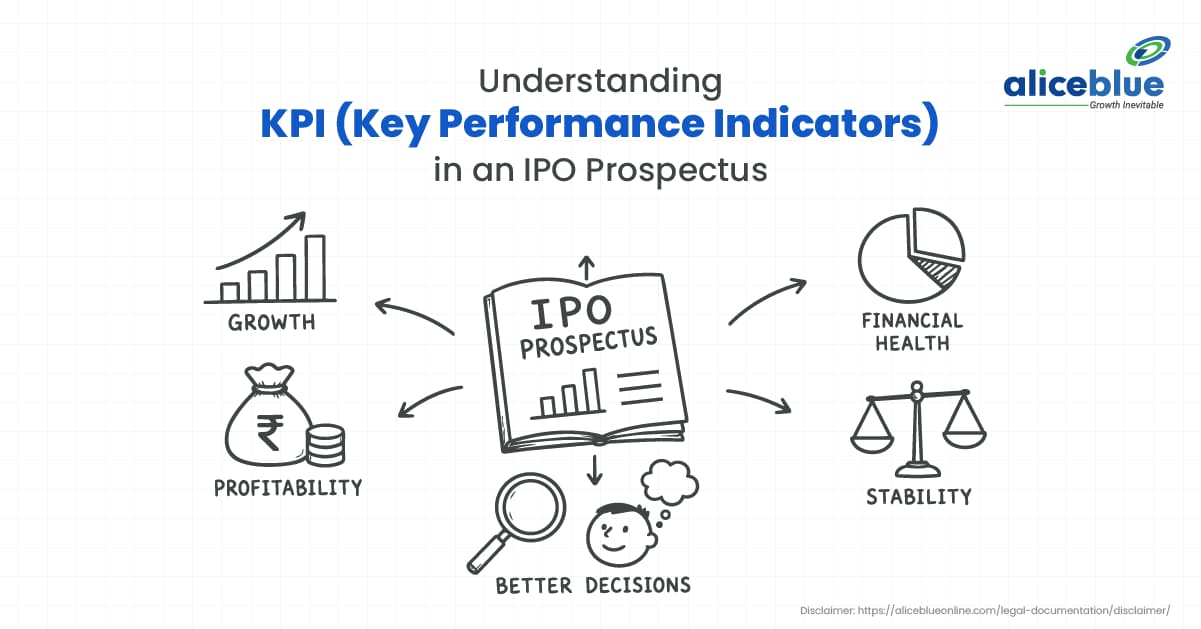
Most retail investors open an IPO prospectus, get overwhelmed by the size of it, and end up making their decision based on the grey market premium or what someone said in a Telegram group. The irony is that the document itself contains everything you need to make an informed call. You just need to know where to look.
That place is the Basis for the Issue Price chapter. Inside it sits a section on Key Performance Indicators, or KPIs. These are the same numbers the company’s management has been tracking internally for years. SEBI made it mandatory for companies to put them in front of every investor before the IPO opens.
Reading these numbers does not require a finance degree. It requires knowing what to look for and what questions to ask.
What KPIs Are and Why They Are in the Prospectus
A Key Performance Indicator is a measurable number that shows how a business has been doing over time. In an IPO, the company must share these numbers for the three financial years before it goes public.
The purpose is straightforward. Before an IPO, large institutional investors attend private roadshows where management presents detailed performance data. Retail investors never had access to that same information. KPI disclosure was SEBI’s way of correcting that imbalance.
The KPIs in a DRHP cover three things: financial data taken directly from audited accounts, ratios derived from that data, and operational numbers specific to the company’s business.
How SEBI Changed the Rules
Before November 2022, companies could disclose whatever metrics they chose and present them in whatever format suited them. A startup burning cash could highlight user growth and bury the losses. There was no standard, no verification, and no peer comparison required.
SEBI’s amendment to the ICDR Regulations in November 2022 changed that. Companies had to start disclosing KPIs for three full financial years and compare them against listed peers in the same sector.
In February 2025, SEBI raised the bar again through Industry Standards developed with FICCI, CII, and ASSOCHAM. These came into effect on 1 April 2025. Under these standards:
The MD, CEO, or CFO must personally certify the KPIs before they go into the document. A statutory auditor or a peer-reviewed Chartered Accountant must independently verify them. The Audit Committee must formally approve the final set. The Book Running Lead Manager must review them for consistency with peer disclosures. If any KPI definition changes between reporting years, the company must say so and explain why.
This process did not exist before 2022. Companies could call anything a KPI and present it however they liked. That is no longer the case.
The Three Categories of KPIs in a DRHP
SEBI’s 2025 framework puts all IPO KPIs into three buckets.
The first is GAAP Financial Measures. These come straight from audited financial statements: revenue from operations, profit after tax, and earnings per share.
The second is Non-GAAP Financial Measures. These are calculated from financial data but do not appear directly in the statements: EBITDA margin, RONW, RoCE, PE ratio, Price-to-Book Value.
The third is Operational Measures. These differ completely by industry. A housing finance company shows NPA ratios and AUM growth. A food delivery company shows GMV and active users.
The KPIs You Will See in Most Indian DRHPs
Revenue from Operations
This is income from the company’s actual business only. Investment income, asset sale proceeds, and one-time gains are excluded. Look at the three-year trend. Steady growth in this line means the business is genuinely expanding, not relying on accounting adjustments.
Profit After Tax and PAT Margin
PAT is what the company actually keeps after paying every expense, every interest charge, and every tax. PAT Margin shows what portion of each rupee earned survives as profit. If PAT margin was 4% in FY22 and is 9% in FY24, the company is running a tighter operation than it was two years ago.
EBITDA and EBITDA Margin
EBITDA strips out interest, taxes, depreciation, and amortisation. What you are left with is the profitability of the core business operations before financing costs and non-cash charges come into play. When EBITDA margin improves year after year, the underlying business is running more efficiently.
Return on Net Worth (RONW)
Indian IPO documents call this RONW. Internationally, it is Return on Equity. The formula is net profit divided by shareholders’ net worth, expressed as a percentage. A RONW of 18% means the company generated Rs. 18 in profit for every Rs. 100 of shareholders’ money it held during the year. When this number climbs consistently across three years, it tells you management is putting shareholder capital to better use over time.
Return on Capital Employed (RoCE)
RoCE measures returns on all capital in the business, equity and debt combined. The reason you need this alongside RONW: a company can push up its RONW simply by borrowing heavily and deploying that debt. RoCE captures the full picture. High RONW with weak RoCE is a warning that the profitability is being manufactured through debt, not earned through operations.
Earnings Per Share (EPS)
EPS is net profit divided by total shares outstanding. The prospectus shows both Basic EPS and Diluted EPS. Diluted EPS assumes all ESOPs and convertible instruments have already become shares, so it gives you a more conservative, more honest number for valuation purposes.
Price-to-Earnings (PE) Ratio
The prospectus calculates PE at the issue price and puts it next to the PE ratios of listed peers. If the IPO PE is 42 and the closest comparable company trades at 27, you are paying a 55% premium. Whether that premium makes sense depends on whether the growth and quality KPIs justify it.
Price-to-Book Value (P/BV)
P/BV divides the issue price by the company’s book value per share. Book value is total assets minus total liabilities, divided by shares outstanding. For banks, NBFCs, housing finance companies, and asset-heavy businesses, P/BV is often more useful than PE because asset values in these sectors are more stable than earnings. A high P/BV without strong asset quality or growth to support it is a pricing risk.
Debt-to-Equity Ratio
This shows how much borrowed money the company carries against its own funds. A ratio of 0.8 means Rs. 80 of debt for every Rs. 100 of equity. A ratio of 3 means the business is heavily dependent on borrowing. Capital-intensive sectors naturally carry higher ratios. The right benchmark is the sector peer group, not a universal number.
Market Capitalisation at Issue Price
Market Cap is the issue price multiplied by total post-issue shares. It tells you the size of the company you are buying into. It also places the company in a category: below Rs. 5,000 crore is typically small-cap, Rs. 5,000 to Rs. 20,000 crore is mid-cap, and above Rs. 20,000 crore is large-cap. Comparing the IPO’s market cap with listed competitors immediately tells you whether the company is pricing itself as a market leader or as a challenger. That framing changes how you read every other KPI in the document.
A Real Example: Bajaj Housing Finance IPO (2024)
Bajaj Housing Finance Limited filed its DRHP with SEBI in June 2024. It is a housing finance company, a wholly owned subsidiary of Bajaj Finance, and one of India’s largest mortgage lenders. The IPO was priced at Rs. 66 to Rs. 70 per share with a total issue size of Rs. 6,560 crore.
The following numbers are sourced directly from the company’s Annual Report 2023-24, and the DRHP filed with SEBI:
KPI | FY2024 | FY2023 | FY2022 |
Profit After Tax (Rs. Crore) | 1,731 | 1,258 | 710 |
Net Total Income (Rs. Crore) | 2,925 | 2,454 | Not disclosed |
RONW (%) | 15.2% | 14.6% | 11.1% |
EPS Basic (Rs.) | 2.58 | 1.88 | Not available |
Gross NPA (%) | 0.27% | 0.22% | 0.31% |
Net NPA (%) | 0.10% | 0.08% | 0.14% |
Assets Under Management (Rs. Crore) | 91,370 | 69,228 | 53,322 |
Source: Bajaj Housing Finance Annual Report 2023-24 and DRHP filed with SEBI, June 2024.
A note on NPA before reading the table. NPA stands for Non-Performing Assets. These are loans where the borrower has stopped paying. For any lending company, NPA ratios matter as much as profit numbers. A company aggressively growing its loan book while accumulating bad loans is building a fragile business, regardless of what the top line looks like.
Now look at what this table actually says.
PAT went from Rs. 710 crore in FY22 to Rs. 1,731 crore in FY24. That is 144% growth in two years, not from a single exceptional event, but from a business that compounded profit consistently.
RONW went from 11.1% to 15.2% across three years. The company is earning better returns on shareholders’ money each year, not just growing in size.
AUM grew from Rs. 53,322 crore to Rs. 91,370 crore, which is 71% growth in two years. For a housing finance company, AUM is the most direct measure of business expansion.
Gross NPA rose from 0.22% to 0.27% in FY24. The direction is worth watching, but the absolute level of 0.27% on a book of over Rs. 90,000 crore is among the lowest in the Indian HFC sector. That is genuine asset quality, not just headline management.
The DRHP also placed Bajaj Housing Finance’s PE and P/BV directly alongside LIC Housing Finance and PNB Housing Finance. Investors could see exactly where the pricing stood relative to established peers and form their own view on whether the premium was justified.
Always verify all numbers from the actual DRHP on sebi.gov.in, NSE, or BSE before making any investment decision.
Sector-Specific KPIs: The List Is Not the Same for Every Company
SEBI’s 2025 Industry Standards make clear that different businesses require different KPIs. Applying a standard financial ratio checklist to a SaaS company or a food delivery platform tells you very little.
- Banking and NBFC IPOs: Net Interest Margin, Capital Adequacy Ratio, Gross and Net NPA, Cost-to-Income Ratio
- Retail and E-commerce IPOs: Gross Merchandise Value, Annual Transacting Customers, Average Order Value, Same-Store Sales Growth
- Technology and SaaS IPOs: Monthly Active Users, Revenue per User, Customer Acquisition Cost, Churn Rate
- Manufacturing IPOs: Capacity Utilisation, EBITDA per unit, Inventory Turnover, Working Capital Days
- Real Estate IPOs: Area Booked, Collections, Launch Pipeline, project-level Debt-to-Equity
Identify what kind of business you are looking at first. Then focus on the metrics that actually drive value in that sector.
What to Look for When the Company Is Still Losing Money
When a company has not turned profitable by the time it files for an IPO, traditional financial KPIs cannot give you the full picture. SEBI introduced mandatory operational KPI disclosure largely because of exactly this situation. Indian markets saw multiple growth-stage companies list at high valuations without meaningful financial records, and retail investors were left holding those positions when the businesses failed to perform.
For such companies, focus on:
- Annual Transacting Customers (ATC): How many unique customers completed at least one purchase in the year? If ATC is growing but revenue is flat, average spend per customer is falling.
- Gross Merchandise Value (GMV): Total transaction value through the platform. It measures scale, not profitability, but scale direction matters when the company is pre-profit.
- Average Order Value (AOV): Average spend per transaction. Rising AOV alongside rising ATC is the combination you want to see.
- Monthly Active Users (MAU): How many users are engaging with the platform in a given month. Engagement without transactions has limited commercial value.
- Contribution Margin: Revenue minus variable costs per unit. An improving contribution margin means the business is getting closer to covering its fixed costs and eventually turning profitable.
One point that catches many investors off guard: operational KPIs are company-defined. Two companies in the same sector can both report MAU in their prospectuses and define it completely differently. One counts a user who opened the app once in 90 days. Another counts only users who completed a purchase in 30 days. Both call it MAU. The numbers are not comparable unless you have read the definitions.
Before you compare any operational KPI across two companies, find the definition section in each prospectus and read exactly how the company is calculating that number.
Financial KPIs vs Operational KPIs
Aspect | Financial KPIs | Operational KPIs |
Where it comes from | Audited financial statements | Internal management systems |
Standardisation | Governed by accounting standards | Each company sets its own definition |
Who verifies it | Statutory auditor | Auditor certification and Audit Committee approval |
Most useful for | Profitable, established companies | Growth-stage or loss-making companies |
Peer comparison approach | Apply directly | Read definitions before comparing |
Post-listing reporting | Required under SEBI 2025 | Required under SEBI 2025 |
A Practical Reading Order for Any DRHP
Go to the Basis for Issue Price chapter before anything else.
Check the three-year direction before you look at absolute numbers. Are revenue, PAT, and EPS consistently moving up across all three years?
Look at the margin progression next. PAT margin and EBITDA margin trends tell you whether the business is getting more efficient or whether costs are eating into growth.
Read RONW and RoCE together. Neither number means much without the other.
Find the peer comparison table. Compare PE, P/BV, and RONW with every listed peer the company has disclosed. This is where you judge whether the pricing is fair.
For tech and startup IPOs, switch focus entirely to GMV growth, ATC trend, and contribution margin direction. Traditional financial ratios will not tell you what you need to know.
Look for any year where a KPI definition changed. When this happens, the prospectus must disclose it. A metric that was redefined in a way that flatters the company’s numbers is a flag worth raising.
Finally, connect the KPIs to the Objects of the Issue. SEBI requires post-listing KPI reporting to continue until IPO proceeds are fully deployed as per those stated objects. A company that is slow to deploy its raised capital keeps reporting for longer, which means you have more time to track whether the business is performing the way it promised.
Mistakes That End Up Costing Money
- Looking at RONW without checking the debt behind it. A 24% RONW looks excellent until you see a debt-to-equity ratio of 4. The returns are borrowed, not built.
- Seeing a large PAT number and reading it as healthy without checking the direction. Rs. 300 crore in profit today is not impressive if it was Rs. 430 crore two years ago. A company with growing revenue and shrinking profit is burning through efficiencies it may not recover.
- Skipping the peer comparison table. A PE of 50x on a high-growth speciality chemicals company may be completely rational. The same PE on a mature, slow-growing business is a very different conversation.
- Reading GMV from a tech IPO without checking the definition. Whether cancellations and returns are included changes that number significantly, and the difference can be tens of thousands of crores on a large platform.
- Assuming the company stops reporting KPIs after listing. Under SEBI’s 2025 framework, companies must keep reporting the same KPIs at least once a year after listing until one year from the listing date or until IPO proceeds are fully deployed per the Objects of the Issue, whichever is later. The accountability does not end when the IPO closes. Track the numbers after listing.
Conclusion
Next time you sit down with a DRHP, go straight to the Basis for Issue Price chapter. Three years of rising RONW, an AUM that grew 71%, a PAT that more than doubled, and NPA ratios among the best in the sector: those numbers tell you more than any IPO review article or subscription data will. KPIs are the record of what the company actually built before it asked you for your money. With SEBI now requiring personal certification from the MD or CEO, independent auditor verification, and Audit Committee approval from April 2025, this section carries more accountability than it ever has before. All of that information is sitting in a free, publicly available document on sebi.gov.in. Reading it carefully before you apply is the most straightforward thing you can do to invest in IPOs with your eyes open.
Frequently Asked Questions
KPIs are measurable financial and operational figures that companies must disclose in their IPO prospectus. SEBI’s November 2022 ICDR amendment made it mandatory for all companies to include three years of KPI data along with peer comparisons in every offer document.
The KPI section sits inside the Basis for Issue Price chapter. Every DRHP is available for free download on sebi.gov.in, and on the NSE and BSE websites, usually within days of filing.
RONW and RoE are the same metric with different names. Indian IPO documents use RONW. It divides net profit by shareholders’ net worth and expresses the result as a percentage. Rising RONW across three consecutive years shows management is using capital more productively over time.
Yes. Under SEBI’s April 2025 guidelines, the MD, CEO, or CFO must personally certify the KPIs. A statutory auditor or peer-reviewed Chartered Accountant independently verifies them. The Audit Committee gives final approval before anything enters the document.
PE compares the issue price to earnings per share. P/BV compares it to the company’s book value per share. For banks, NBFCs, and asset-heavy businesses, P/BV is usually the more useful measure because earnings fluctuate more sharply than asset values in those sectors.

Blog by Aliceblue News Desk


