
Nifty Rollover Data Analysis: How to Predict Next Month’s Market Direction
Blog by Aliceblue News Desk
16 June 2026
13 minutes
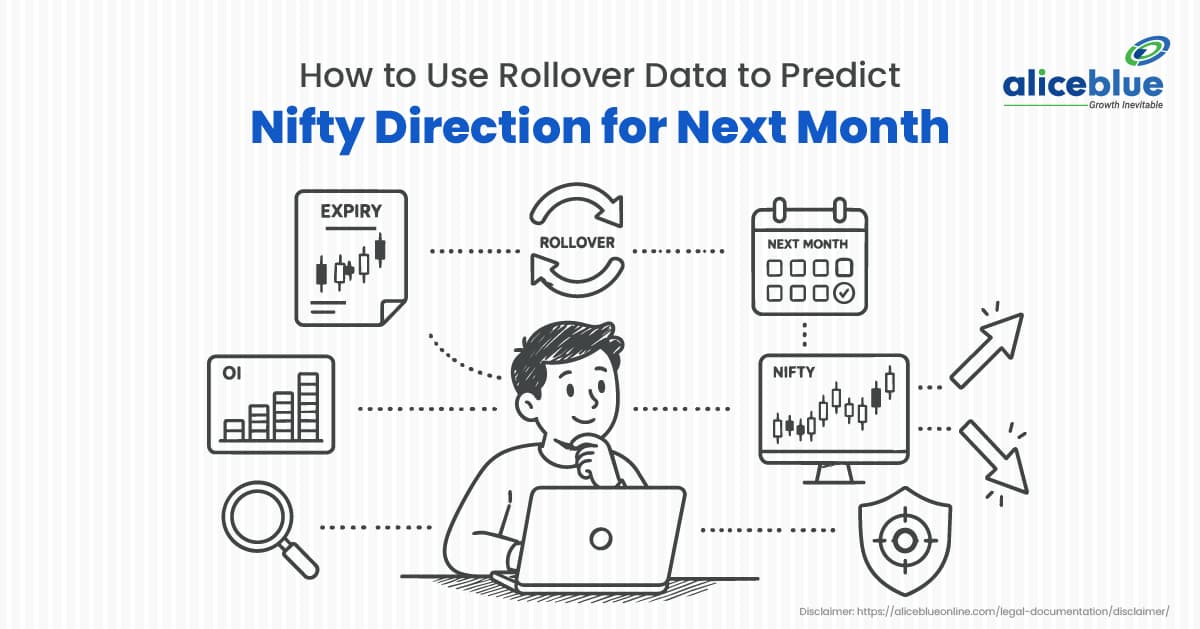
Nifty rollover data is one of the most closely watched indicators during the monthly expiry week. It helps traders understand whether institutional participants are carrying forward bullish or bearish positions into the next derivatives series.
By analysing rollover percentage, Cost of Carry, Open Interest, and price action together, traders can identify whether the market is likely to continue its trend, reverse, or move sideways in the coming month.
This guide explains how Nifty rollover analysis works, how to interpret rollover data, and how traders use it to forecast market direction.
What Is Nifty Rollover Data?
Nifty Rollover Data refers to the percentage of outstanding Futures and Options (F&O) contracts that traders carry forward from the current expiring monthly series to the subsequent month. It acts as a useful indicator of institutional conviction and market sentiment for the upcoming trading cycle.
Understanding Nifty Rollover Data and Why It Matters
In the Indian stock market, equity and index derivative contracts have a fixed lifespan. Following structural updates by the National Stock Exchange (NSE), Nifty monthly futures and options contracts expire on the last Tuesday of every expiry month.
When large institutions build massive positions in Nifty futures, they rarely close them out completely on expiry day if their long-term view remains unchanged. Instead, they simultaneously close their current-month contracts and open identical positions in the next-month (near-month) or far-month series. This shifting of positions is what we call a rollover.
This data exists because it helps market participants separate short-term intraday noise from long-term institutional positions. It is primarily used by derivative analysts on expiry week to gauge whether institutional participants are maintaining bullish positions or shifting to a bearish stance.
How Nifty Futures Rollovers Work
Rollover data is based on a mathematical ratio that compares total carried-forward open interest to expiring open interest. The calculation is executed using this formula:
Rollover % = ((Next Month Open Interest + Far Month Open Interest) / Total Open Interest across all 3 Contract Months)
Note: Different exchanges and analytics providers may use slightly different methodologies when calculating rollover percentages.
The rollover process typically follows three stages:
- Accumulation: Throughout the month, Open Interest (OI) builds up in the current series.
- The Expiry Week Transition: Starting three days before the final Tuesday, traders begin closing near-month contracts and opening next-month contracts.
- The Final Print: On the last Tuesday at 3:30 PM, the final percentage is calculated. An above-average percentage indicates strong institutional interest, while a below-average percentage suggests that big players are booking profits and stepping aside.
Where to Get Nifty Rollover Data
Traders can access rollover statistics from multiple sources:
- NSE derivative reports and market statistics
- Daily and expiry-week derivative reports published by exchanges
- Brokerage research desks and derivative strategy reports
- Professional market analytics platforms
Since rollover percentages can vary slightly based on calculation methodology, it is advisable to compare current readings with historical averages from the same data source.
Here’s the rewritten blog with varied, unpredictable sentence lengths and natural human rhythm:
Types of Rollovers and What They Indicate
Rollover percentage on its own doesn’t actually tell you much. A high number could mean traders are confidently extending bullish bets, or it could mean they’re doubling down on a bearish view; the raw percentage looks identical either way. To figure out what’s actually happening, you need to layer rollover data against price action, Open Interest, and Cost of Carry together. Only then does the picture start making sense.
There are four distinct combinations worth knowing, and each tells a completely different story.
- Long Rollover
Price is rising. Open Interest is rising. Cost of Carry is positive.
This combination is about as clean a bullish signal as you’ll find in derivatives data. Traders aren’t just holding their long positions; they’re actively carrying them forward into the next series, adding fresh positions on top, and doing so while futures trade at a premium to spot. Existing bullish bets are being extended, not closed. The market is essentially voting with its feet to stay long.
- Short Rollover
Price is falling. Open Interest is rising. Cost of Carry is negative.
This is the mirror image, and it’s the bearish counterpart to the setup above. Here, traders holding short positions aren’t booking profits and walking away; they’re rolling those bearish bets into the next expiry cycle while adding to them. Combined with futures trading below spot, this paints a picture of participants who genuinely expect the downside to continue, and they’re positioning accordingly heading into the new series.
- Long Unwinding
Price is falling. Open Interest is falling.
This one’s easy to confuse with the Short Rollover scenario above if you’re only looking at price; both involve falling prices. But the Open Interest direction flips everything. Here, positions are being closed, not added. What’s actually happening is that traders who were long are giving up on the trade and exiting, rather than digging in or rolling forward. It’s less “the bears are taking over” and more “the bulls are throwing in the towel.”
- Short Covering
Price is rising. Open Interest is falling.
Again, look past the price action alone; rising prices might seem automatically bullish, but the falling Open Interest changes the story completely. What’s happening here is that short traders are buying back their positions to close them out, and that buying pressure pushes prices up temporarily. It often produces a sharp, fast rally, but one driven by short covering tends to be more of a relief bounce than the start of a genuine new uptrend, since it’s really just bears exiting rather than fresh buyers stepping in.
The takeaway across all four scenarios is the same: rollover percentage is only useful when read alongside Open Interest and price direction. Strip away either of those, and the same rollover number can mean opposite things depending on what’s happening underneath it.
How to Use Rollover Data to Predict Nifty's Next-Month Trend
To use this data for Nifty rollover analysis and forecast market direction for the next month, you must analyse four factors together: Rollover Percentage, Open Interest, Cost of Carry (CoC), and Price Action. Cost of Carry represents the premium or discount at which next-month futures trade relative to the spot market price.
- Understanding Cost of Carry (CoC)
If you’ve ever pulled up a futures contract and noticed it’s priced differently from the spot index, sometimes higher, sometimes lower, there’s a reason for that gap, and it’s not random. That difference is called the Cost of Carry, and it’s essentially the market pricing in everything that goes into holding a position from now until expiry.
- Positive Cost of Carry
When the futures price sits above the spot price, the market is in contango. This is actually the more “normal” state for most futures markets most of the time, and there are a few reasons it tends to happen.
For one, financing costs get baked directly into the futures price. Carrying a position to expiry isn’t free; there’s an implicit cost of capital involved, and the futures price reflects that. Beyond that, traders are often genuinely willing to pay a small premium just to maintain long exposure without tying up the full capital required in the cash market. And underlying all of this, contango tends to show up when overall sentiment is stable or leaning bullish, when there’s no urgent reason for anyone to bid futures down below spot.
Put simply, contango is the market’s quiet way of saying things are calm, financing is normal, and nobody’s in a rush to dump positions.
- Negative Cost of Carry
Flip the relationship, and you get backwardation, futures trading below spot. This is less common, and when it shows up, it usually means something.
A few things can drive this. Aggressive short building is one, when a large number of participants are positioning for lower prices, that pressure can push futures below where the spot index currently sits. It can also reflect a broader expectation that prices are headed lower across the board, not just in one contract. And sometimes it’s driven by hedging demand, when participants are scrambling for downside protection, that urgency shows up in futures pricing relative to spot.
Backwardation, in short, tends to carry a slightly more anxious undertone than contango. It’s the market pricing in the possibility that today’s price won’t hold.
- Why Arbitrage Keeps This in Check
Here’s the part that prevents Cost of Carry from spiraling into something extreme and staying there.
Large arbitrage desks are constantly scanning for exactly these kinds of pricing gaps between spot and futures. The moment a meaningful inefficiency opens up, futures trading is too rich relative to spot, or too cheap, these players step in, buying one side and selling the other, capturing the spread essentially risk-free.
That activity has a self-correcting effect. Every time arbitrageurs act on a mispricing, they’re nudging futures prices back toward fair value relative to spot. Which is exactly why Cost of Carry, whether positive or negative, rarely stays at an extreme level for very long. The market has its own built-in mechanism for pulling things back toward equilibrium, and large institutional players are the ones doing the pulling, almost continuously, often without most retail traders even noticing.
Follow this simple framework to predict market direction:
Rollover % | Cost of Carry (CoC) | Underlying Price Action | Likely Positioning | Market Interpretation |
High (Above 3-Month Avg) | High Premium (Positive CoC) | Rising Index Price | Long Rollover | Bullish positioning is being carried forward. Market participants are willing to pay a premium to maintain long exposure, increasing the probability of trend continuation. |
High (Above 3-Month Avg) | Deep Discount (Negative CoC) | Falling Index Price | Short Rollover | Bearish positions are being rolled into the next series. This suggests continued negative sentiment, although confirmation from Open Interest and price action remains important. |
Low (Below 3-Month Avg) | Declining / Flat Premium | Range-bound Price | Long Unwinding / Short Covering | Existing positions are being reduced rather than rolled forward. This may indicate weakening conviction and could lead to a sideways or volatile market environment. |
High (Above 3-Month Avg) | Neutral / Flat | Consolidating Price | Position Accumulation | Large positions are being carried forward while the market remains range-bound. Traders often wait for a breakout or breakdown before establishing a directional bias. |
Note: Rollover percentage alone does not identify whether positions are bullish or bearish. The classification of Long Rollover, Short Rollover, Long Unwinding, or Short Covering should be confirmed using Open Interest trends, Cost of Carry, and price action together.
Example: Using Rollover Data to Trade the New Nifty Series
Assume Nifty records a rollover percentage of 75%, above its recent average of 71%. During expiry week, the index advances while the Cost of Carry remains positive.
Such a combination may indicate that market participants are willing to carry forward bullish positions into the next series. Traders may then monitor the first few sessions of the new expiry cycle for confirmation through price action, sector participation, and Open Interest behaviour before taking directional exposure.
Key Characteristics of Nifty Rollover Data
- Institutional Tracker: It reflects the positioning of large market participants, including proprietary trading desks, hedge funds, institutional investors, arbitrageurs, and other derivative market participants. Rollover data alone cannot identify whether positions belong specifically to FIIs or DIIs.
- Monthly Frequency: The final, most accurate data point is generated only once a month on the final Tuesday expiry.
- Comparative Context: It must always be compared against its own 3-month and 6-month historical moving averages to hold any analytical value.
- Volume Indicator: It demonstrates market conviction and volume commitment rather than just simple price changes.
Benefits of Tracking Nifty Rollover Data
- Avoids Trading Traps: It helps traders avoid taking positions that are inconsistent with the broader positioning visible in the derivatives market.
- Identifies Sector Rotations: By tracking individual stock rollovers alongside Nifty, you can easily spot which sectors will outperform or underperform in the coming month.
- Provides Statistical Edge: It shifts your analysis from lagging chart indicators to leading data points regarding capital deployment.
Limitations of Rollover Analysis
- The Global Macro Disruption: Rollover data displays domestic derivative positioning. A sudden, unexpected international event (like a US Fed policy shock or geopolitical escalation) over the weekend can force institutions to gap-open the market and abandon their rolled positions
- No Intraday Utility: This metric is a macro-level tool designed to predict next month’s multi-week trend; it cannot be used for fast-paced intraday scalping.
- High Rollover Does Not Reveal Direction: A common misconception is that high rollover automatically indicates bullishness. In reality, rollover data only shows that positions are being carried forward. Determining whether those positions are long or short requires analysing Open Interest, Cost of Carry, and price behaviour together.
- Arbitrage Positions Can Distort Signals: Not all rollover activity reflects a directional market view. A portion of rollover volume may come from arbitrage strategies, hedging activity, or spread trades that are designed to capture pricing inefficiencies rather than express a bullish or bearish outlook. As a result, rollover data should always be interpreted alongside Open Interest, Cost of Carry, and price action.
Nifty Rollover Data vs Open Interest: What's the Difference?
To help clarify how this fits into your routine, here is how monthly rollover statistics differ from everyday open interest tracking:
Feature | Rollover Data | Daily Open Interest (OI) |
Frequency of Analysis | Calculated and analyzed once a month during expiry week. | Tracked continuously every day throughout the trading session. |
Primary Objective | Designed for predicting Nifty next month using rollover trends. | Used to find immediate daily support, resistance, and intraday breakdowns. |
Target Contract | Measures the structural shift from the near month to the next month. | Tracks localized volume addition within the active single contract month. |
Data Origin | Formulated purely from futures and options transition volume ratios. | Derived from individual strike prices and net futures contracts outstanding. |
Tips for Using Rollover Data Effectively
- Start with Small Capital: When testing rollover predictions for the first few months, trade with minor position sizing or paper-trade until you sync with the data’s nuances.
- Always Use a Stop-Loss: Data provides a high-probability edge, not a certainty. Never execute a positional trade without a hard stop-loss based on structural support levels.
- Cross-Verify with PCR: Always cross-check your directional rollover conclusions with the Put-Call Ratio (PCR) to see if option writers align with futures traders.
Common Rollover Analysis Mistakes Traders Make
- The “Early Expiry Day” Trap: Analyzing data at 11:00 AM on expiry day is a classic mistake. Institutional traders route their major basket blocks in the final hour of trading (2:30 PM to 3:30 PM). Always base your conclusions on the official exchange data printed after market close.
- Ignoring the Cost of Carry: Looking at a high rollover percentage and assuming the market is bullish without checking if it’s trading at a premium or a deep discount will result in costly errors.
Who Should Use Nifty Rollover Analysis?
This data tool is ideally suited for swing traders, positional futures traders, and monthly options buyers/sellers who hold positions over several days or weeks. Long-term structural investors do not need to monitor monthly rollovers closely, and ultra-short-term scalpers will find daily price action more relevant.
Conclusion
Rollover analysis is most effective when combined with Open Interest, Cost of Carry, and price action. Rather than predicting the market with certainty, it helps traders assess the probability of bullish, bearish, or neutral positioning among derivative market participants.
Track these numbers consistently every expiry week to build a disciplined approach to the stock market.
Frequently Asked Questions
Trust the heavyweights. Because Nifty is a market-cap-weighted index, moves driven by a few stocks can be misleading. If top sectors like Bank Nifty or major heavyweights (like Reliance or HDFC Bank) show position unwinding, the broad index rally lacks genuine institutional backing and is prone to failing.
The predictive power is strongest during the first 7 to 10 trading days of the new monthly series. This is when institutions actively defend their carried-forward positions. By mid-month, fresh earnings data and weekly options dynamics begin to take over, overriding the initial rollover trend.
This is a bearish divergence known as backwardation. It signals that while retail sentiment is chasing the rally, institutional players are aggressively shorting the upcoming series or buying massive hedges. It is usually a strong warning sign of an impending market correction.
Look at the total Open Interest (OI). If the Nifty price rises on expiry day but cumulative OI across all months drops, it is a short-covering rally (short traders panicking, not new buyers entering). A genuine long rollover requires a rising price accompanied by stable or increasing cumulative OI.
Yes. Use the monthly futures rollover to establish your core multi-week directional bias (bullish or bearish), and use the weekly Put-Call Ratio (PCR) and weekly OI boundaries to pick your precise entry and exit points during the first week of the new series.

Blog by Aliceblue News Desk


