Price to Sales Ratio: What It Is and When to Use It in Stock Investing
Blog by Aliceblue News Desk
25 May 2026
13 minutes
Introduction
When Zomato listed on the NSE in July 2021, the P/E ratio was not just high. It did not exist. The company was reporting losses, so there were no earnings to divide. Analysts quoting a P/E of 500x were not being informative. They were working around a broken metric.
Institutional investors were not confused, though. They were using a different valuation tool: the Price to Sales ratio, or P/S ratio. It ignores profitability and focuses purely on revenue. Revenue is something every operating business generates, even years before it turns a profit.
If you invest in or plan to invest in any of India’s newer listed companies in technology, food delivery, beauty retail, or fintech, understanding the P/S ratio is not optional. It is one of the most practical tools available for evaluating businesses that the P/E ratio simply cannot handle.
What Is the Price-to-Sales Ratio?
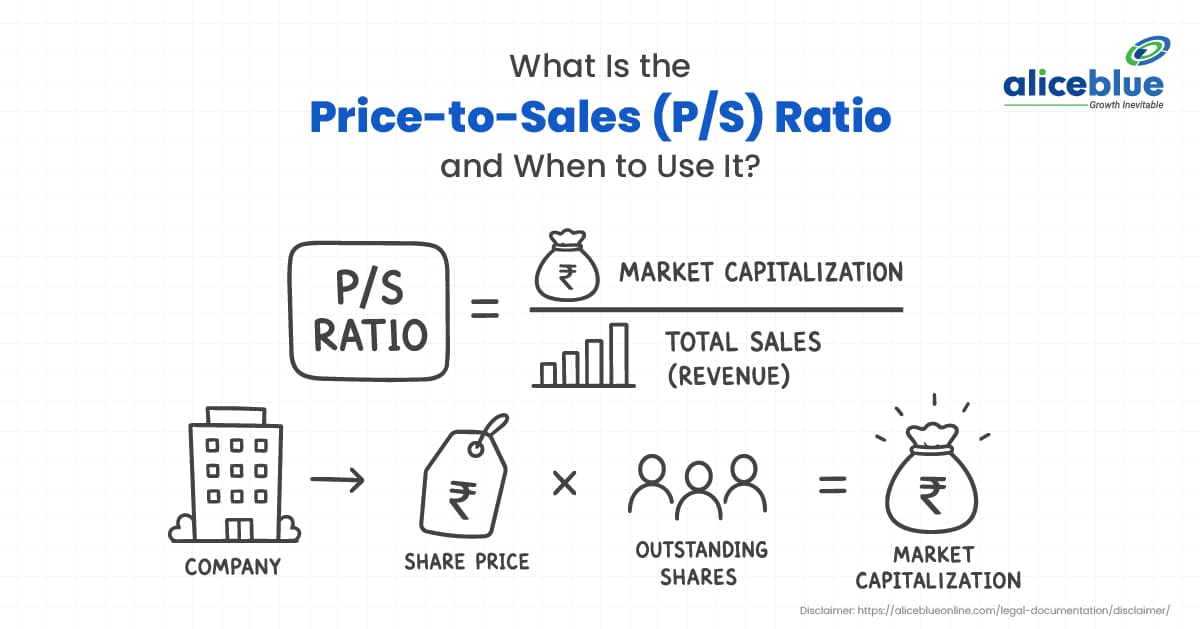
The Price to Sales ratio compares a company’s market value to the revenue it generates annually. It answers one specific question: how much are investors paying for every rupee of sales this company produces?
The metric was introduced by investor Kenneth L. Fisher in his 1984 book Super Stocks. Fisher’s reasoning was grounded in a direct observation. Earnings can be manipulated. Companies can adjust depreciation schedules, defer expenses, and use tax strategies to change reported profits significantly from one year to the next. Revenue reflects actual money coming in from customers and is far harder to distort through accounting decisions.
Fisher also argued that even genuinely strong companies go through multi-year periods where reported earnings disappear due to expansion costs, one-time charges, or economic downturns. During those periods, the P/E ratio stops functioning. The P/S ratio continues to give investors a workable number.
In India today, this applies directly to the large number of new-age companies listed on NSE and BSE that are still in their growth phase. For these companies, the P/E ratio either does not exist or produces a number so large it offers no useful guidance.
How to Calculate the P/S Ratio
There are two equivalent methods.
Method 1 using market capitalisation:
P/S Ratio=Market Capitalisation / Annual Revenue (TTM)
P/S Ratio = Annual Revenue (TTM) / Market Capitalisation
Method 2 using per share figures:
P/S Ratio = Current Stock Price / Revenue Per Share
P/S Ratio = Revenue Per Share / Current Stock Price
TTM stands for Trailing Twelve Months. It combines revenue from the four most recent quarters. Analysts prefer TTM over standalone annual figures because it reflects the most current business performance rather than a figure that may be twelve to twenty-four months old.
To calculate it yourself:
- Find the company’s current market capitalisation on any stock screener or exchange website
- Find TTM revenue from the company’s latest quarterly results by adding the last four quarters
- Divide market cap by TTM revenue
Always verify the date of the data before using it in any analysis, since market capitalisation changes daily with the stock price.
Real Examples from the Indian Stock Market
Zomato (NSE: ZOMATO)
At its IPO in July 2021, Zomato was priced at approximately 19.7x its FY22 estimated revenue at the upper price band of ₹76 per share. The company’s FY21 revenue stood at ₹1,994 crore, and it was reporting a net loss. With no usable earnings figure, P/S was the primary metric analysts used to assess whether the IPO pricing was reasonable relative to comparable businesses.
By May 2026, Zomato’s P/S ratio had compressed to approximately 6.46x as revenue scaled significantly. The P/E ratio stood at around 286x at the same point. The P/E ratio remains too large for practical peer comparison. The P/S ratio at 6.46x gives a more grounded picture of how the market is currently valuing each rupee of Zomato’s sales relative to where it was priced at IPO.
Nykaa (NSE: NYKAA)
When Nykaa listed in November 2021, it was priced at 21.0x to 21.8x its FY21 revenue of ₹2,441 crore. Its market cap crossed ₹1 lakh crore on the listing day. Investors were paying over ₹21 for every ₹1 of revenue Nykaa had generated the previous year. That valuation only made sense if Nykaa could sustain the strong annual revenue growth it had delivered in the years leading up to the IPO.
As of May 2026, Nykaa’s P/S had compressed to 8.95x on TTM revenue of approximately ₹8,359 crore. Its P/E ratio sits at 937x, which is practically unusable for valuation comparison. For anyone tracking Nykaa, the P/S ratio remains the more meaningful starting point for comparing it against sector peers.
Dixon Technologies (NSE: DIXON)
Dixon manufactures consumer electronics under contract for brands like Samsung, Motorola, and Xiaomi in India. Based on its May 2026 market cap of approximately ₹66,749 crore and TTM revenue of ₹48,437 crore, its P/S ratio stands at approximately 1.37x.
The contrast between Dixon at 1.37x and Zomato at 6.46x is not a signal that Dixon is cheap and Zomato is expensive. It reflects a structural difference between the two businesses. Dixon earns thin margins on high-volume manufacturing. Zomato operates a platform model where margins are expected to expand as the business scales. Investors pay more per rupee of platform revenue because the earnings potential per rupee of that revenue is higher.
This is the central interpretation challenge with P/S ratios. A lower number is not automatically better. Sector context and margin direction both determine what any P/S figure actually means.
When the P/S Ratio Is Most Useful
- Loss-making or pre-profit companies. When a company has no earnings, the P/E ratio produces a negative or meaningless figure. The P/S ratio gives a workable number for peer comparison regardless of profitability. For a full explanation of how the P/E ratio works when a company does have earnings, the Alice Blue blog on PE Ratio covers the calculation, benchmarks, and when to apply it.
- IPO valuation. When pre-profit companies are listed, analysts use P/S multiples to compare the offer price against similar businesses at a comparable growth stage. Both the Zomato and Nykaa IPOs were primarily evaluated on P/S terms by institutional analysts.
- Cyclical sectors. In industries like chemicals, construction, or auto components, profits swing sharply with economic cycles while revenue holds more steady. P/S gives a more consistent read across the cycle.
- Peer comparison within the same sector. Comparing two fintech platforms or two FMCG companies using P/S shows how differently the market is pricing each business relative to the revenue it generates.
- Subscription and recurring revenue businesses. Companies with predictable, recurring revenue are well-suited to P/S analysis because the stability of the revenue base makes comparisons more reliable than for businesses with lumpy or seasonal sales.
- Screening for undervalued stocks. A P/S below 1 means the market is valuing the company at less than one year of its own revenue. This can indicate undervaluation, though it always requires further investigation before concluding.
Kenneth Fisher's Original P/S Benchmarks
Fisher outlined specific P/S thresholds in Super Stocks as guidelines for identifying buying opportunities:
Company Type | Strong Buy Zone | Acceptable Zone | Avoid Zone |
Non-cyclical and technology stocks | Below 0.75 | 0.75 to 1.5 | Above 3.0 |
Cyclical stocks | Below 0.4 | 0.4 to 0.8 | Above 1.2 |
Fisher always combined these thresholds with debt levels, profit margin trends, and earnings growth before acting on any P/S signal. He never used P/S as a standalone buy trigger.
One important point for Indian investors: Fisher’s framework was designed for mature, profitable businesses where revenue and earnings move in step with each other. For high-growth platform companies like Zomato, where revenue is growing 30% to 40% annually, and profitability is still developing, Fisher’s “avoid above 3.0” threshold does not apply the same way. The P/S ratio for such businesses must be read alongside revenue growth rate and margin trajectory, not against a static number built for a different era of investing.
Why Sector Context Determines Everything
P/S ratios differ across sectors because profit margins differ. A business with high net margins justifies a higher price per rupee of revenue because more of that revenue eventually becomes profit. A business with thin margins needs to be priced lower per rupee of sales.
The connection between margin and P/S reveals a useful calculation. If a company has a P/S of 5x and a net margin of 20%, its implied P/E is 25x (5 divided by 0.20). If a different company has the same P/S of 5x but only a 5% net margin, its implied P/E is 100x. Two companies with identical P/S ratios can represent very different value propositions once you factor in what percentage of revenue actually reaches the bottom line.
The sector ranges below are approximate and based on historical Indian market data. For detailed industry-level revenue multiples, Professor Aswath Damodaran of NYU Stern publishes an annual dataset that analysts widely reference.
Sector | Typical P/S Range | Approximate Net Margin |
IT Services | 3x to 8x | 18% to 22% |
Consumer Tech and E-commerce | 5x to 15x | 5% to 15% (expanding) |
FMCG | 3x to 6x | 10% to 15% |
Pharma | 2x to 5x | 10% to 18% |
Auto and Auto Ancillaries | 0.5x to 2x | 4% to 8% |
Capital Goods and Engineering | 1x to 3x | 6% to 10% |
Retail | 0.3x to 1.5x | 2% to 5% |
Always compare a stock’s P/S against direct sector peers, not against a universal benchmark.
The PSG Ratio: Adding Growth Context to P/S
The P/S ratio on its own does not account for how fast a company’s revenue is growing. A company trading at 10x P/S with 60% annual revenue growth may be more sensibly priced than one trading at 4x P/S with 5% growth.
The PSG ratio addresses this directly:
PSG Ratio = P/S Ratio / Expected Revenue Growth Rate (%)
PSG Ratio = Expected Revenue Growth Rate (%) / P/S Ratio
A PSG below 0.5 generally suggests the stock may be attractively priced relative to its growth. A PSG above 1.0 suggests the market may already be pricing in the growth, leaving limited room for upside if growth slows or misses expectations.
Like P/S itself, the PSG ratio works best as a comparative tool within the same sector rather than as a standalone signal.
Advantages of the P/S Ratio
- Works when P/E does not. For any company in the red, P/S provides a usable valuation figure for comparison with peers.
- Revenue is harder to manipulate. Unlike earnings, revenue reflects actual customer payments and cannot be adjusted through depreciation policy, deferred tax recognition, or one-time charge timing.
- Always a positive number. As long as a company generates any sales, the P/S ratio exists and can be compared across peers.
- Applicable to forward estimates. Analysts use projected next-year revenue to calculate a forward P/S, which helps assess whether today’s price is reasonable given near-term growth expectations.
- Useful for IPO screening. When a company has a limited earnings history, comparing its IPO P/S against similar listed peers is often the most practical first valuation check available.
Limitations: Where the P/S Ratio Stops Working
- It ignores profitability entirely. Two companies with the same P/S ratio can be in completely different financial positions. One might generate 25% net margins. The other might be burning cash at a rapid pace. The ratio treats their revenue identically.
- Debt is invisible. A company carrying ₹5,000 crore in debt and one with zero debt will show the same P/S if their market caps and revenues match. For companies in infrastructure, telecom, or large-format retail that typically carry significant debt, the EV/Sales ratio is more accurate. EV/Sales uses Enterprise Value, which adds total debt and subtracts cash before dividing by revenue, giving a truer picture of what you are paying for the entire business rather than just the equity.
- Revenue quality is not captured. ₹1,000 crore in high-margin software licensing is not the same business as ₹1,000 crore in commodity distribution. P/S treats both figures identically.
- Not suitable for financial companies. Banks, NBFCs, and insurance companies have fundamentally different income structures. Applying P/S to a bank’s interest income produces a misleading number. Price to Book (P/B) is the appropriate metric for these businesses. The Alice Blue blog on PE Ratio, PB Ratio and EV/EBITDA explains how P/B works and which sectors it is most applicable to.
P/S Ratio vs P/E Ratio
Feature | P/S Ratio | P/E Ratio |
Based on | Revenue | Net profit |
Works for loss-making companies | Yes | No |
Can produce a negative number | No | Yes |
Manipulation risk | Lower | Higher |
Reflects profitability | No | Yes |
Best suited for | Growth, pre-profit, early-stage companies | Mature, consistently profitable companies |
For a company like Zomato or Nykaa, start with P/S to understand how the market is valuing revenue. Then layer in gross margin trends and EBITDA direction to build a fuller picture. For a company like Infosys or Asian Paints, the P/E ratio and Return on Equity are more informative starting points. Both metrics work better in combination than either does alone.
Common Mistakes Beginners Make
- Comparing P/S ratios across different sectors. A P/S of 2x for a software company means something structurally different from a P/S of 2x for a steel distributor. The margin profiles are incomparable. Sector-level comparison is the only valid approach.
- Treating a low P/S as an automatic buy signal. A P/S below 1 can reflect undervaluation in a fundamentally sound business. It can equally reflect a company losing market share, carrying heavy debt, or operating in a structurally declining industry. The number demands investigation, not immediate action.
- Ignoring margin direction. A seemingly reasonable P/S on a company whose gross margins are narrowing each quarter is not comforting. Revenue quality and margin trajectory determine what the P/S number actually means.
- Mixing TTM and annual data. Comparing one company using TTM revenue against another using last full-year annual revenue distorts every calculation. Always use the same time period across both companies you are comparing.
- Using P/S as the only input for a decision. P/S is a starting filter. It opens the right questions. It does not answer them on its own.
Who Should Use the P/S Ratio
Use it when you are:
- Researching listed growth companies in technology, e-commerce, or fintech that have not yet reached consistent profitability
- Evaluating an IPO where the company has limited or no earnings history
- Comparing companies within the same sector to understand how differently the market is pricing each
- Screening for potentially undervalued stocks in mature, low-margin industries like retail or auto components
Be careful when you are:
- Analysing banks, NBFCs, or insurance companies, where Price to Book is the more appropriate tool
- Evaluating companies with significant debt, where EV/Sales gives a more accurate comparison
- Approaching a final investment decision, since P/S must be combined with margin trends, debt levels, and revenue growth, before any conclusion is valid
Conclusion
The P/S ratio works when most other common valuation metrics stop functioning. In India’s current market, where a meaningful portion of listed growth companies are still building toward profitability, that makes it a practical tool rather than a niche one.
On its own, the number tells you very little. Alongside sector peers, margin direction, and revenue growth rate, it tells you quite a lot. The context is everything, which is why the first step is always comparison, not the absolute figure itself.
Frequently Asked Questions
The P/S ratio divides a company’s market capitalisation by its annual TTM revenue. It tells you how much investors are paying for every rupee of sales the company generates, regardless of whether it is profitable.
Kenneth L. Fisher introduced the P/S ratio in his 1984 book Super Stocks. He developed it because he believed earnings were too easily adjusted through accounting decisions, while revenue more reliably reflected the underlying strength of a business.
Fisher’s original benchmarks suggest below 0.75 as a strong buy zone for non-cyclical and technology stocks and below 0.4 for cyclical businesses. In practice, sector norms vary widely in India. IT services companies commonly trade at 3x to 8x, while auto and capital goods companies trade between 0.5x and 2x. Comparing within the same sector is the only valid approach.
Both companies had no stable earnings at the time of their listings. Zomato was priced at approximately 19.7x its FY22 estimated revenue. Nykaa was priced at 21.0x to 21.8x its FY21 revenue of ₹2,441 crore. With P/E ratios either negative or impractical, analysts used P/S to assess whether these IPO prices were reasonable relative to comparable businesses.
The P/S ratio uses market capitalisation, representing only the equity portion of a company’s value. EV/Sales uses Enterprise Value, which adds total debt and subtracts cash before dividing by revenue. For companies carrying significant debt, EV/Sales gives a truer picture of what you are paying for the entire business, not just the equity.
The PSG ratio divides the P/S ratio by the expected revenue growth rate. It adds growth context to a static P/S number, helping investors assess whether a high P/S is justified by strong revenue expansion. A PSG below 0.5 is generally considered attractive; above 1.0 suggests the growth may already be priced in.

Blog by Aliceblue News Desk