
Put-Call Ratio Explained: Spot Market Tops & Bottoms Using PCR
Blog by Aliceblue News Desk
08 April 2026
7 minutes
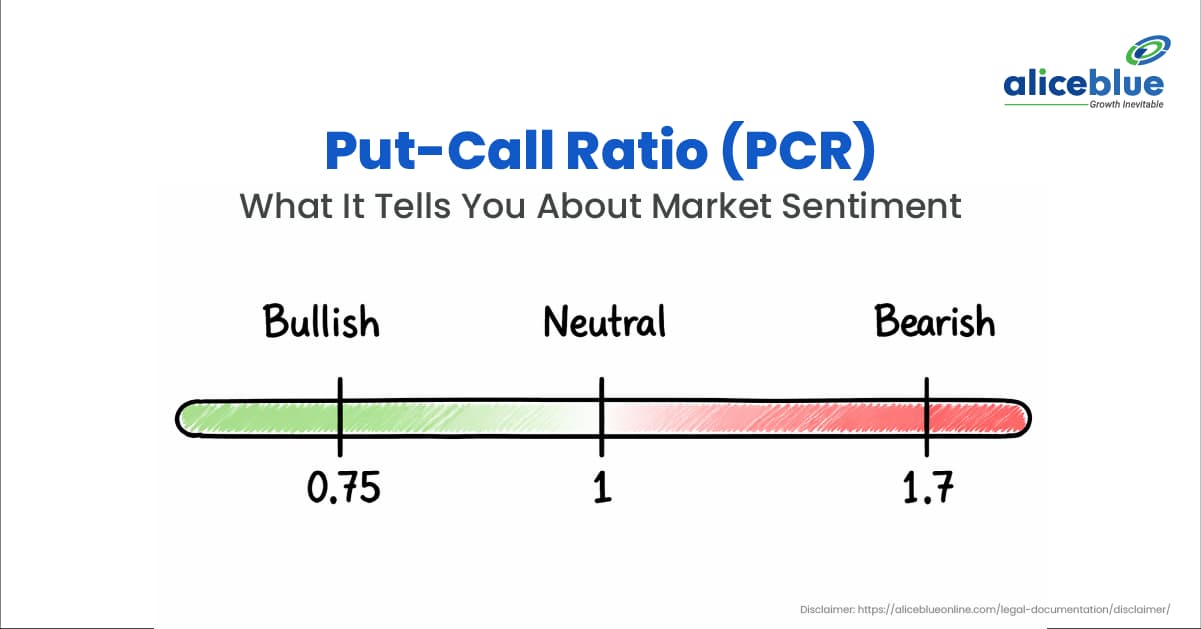
Markets often fall when traders feel confident, and rise when fear is high. Why?
The answer lies in the Put-Call Ratio (PCR), a simple tool that reveals real market sentiment behind the scenes. If you’ve ever been confused during big Nifty moves, PCR can help you spot potential tops and bottoms with more clarity.
In this blog, we will see what PCR is in detail and how to use it.
Basics of Put and Call Options
Options trading mainly revolves around two types: calls and puts.
A call option is used when you expect prices to rise. It gives you the right to buy at a fixed strike price, even if the market goes higher. For example, if Nifty is at 24,000 and you buy a 24,500 call, you profit if Nifty moves above 24,500 plus the premium.
A put option is used when you expect prices to fall. It gives you the right to sell at the strike price, even if the market drops below it.
Buyers pay a premium, which is their maximum possible loss. Sellers earn the premium but take on higher risk. In India, one Nifty options contract represents 25 units of the index.
Quick Summary:
- Call: Expect rise; right to buy.
- Put: Expect fall; right to sell.
- Buyer risk: Limited to premium.
- Seller risk: High.
What is the Put-Call Ratio (PCR)?
The Put-Call Ratio (PCR) is a tool to check market mood through options data. It divides total put options activity by total call options activity, using either trading volume or open interest. High PCR means more traders buy puts for protection, showing fear. Low PCR means more calls, showing greed or bullish bets.
Traders view it as a contrarian signal. Very high PCR (over 1.2) may signal a bottom, while very low (under 0.7) may signal a top. NSE shares daily PCR for Nifty and Bank Nifty.
How to Calculate the Put-Call Ratio?
To calculate PCR, you start by collecting data on put and call options for an index like Nifty or a stock. There are two common types: one based on open interest and the other on trading volume. Always sum up figures across all strike prices before dividing.
Based on Open Interest PCR:
This measures active contracts held at the end of the trading day. Use this formula: PCR = Total Put Open Interest ÷ Total Call Open Interest.
For example, suppose Nifty puts show 2 lakh contracts open across all strikes. Calls show 4 lakh contracts open. Then PCR = 2,00,000 ÷ 4,00,000 = 0.5. This suggests traders expect prices to rise.
Open interest builds over days and reflects longer-term views.
Based on Trading Volume PCR:
This tracks contracts traded during market hours. Use this formula: PCR = Total Put Volume ÷ Total Call Volume.
For example, if 1 lakh put contracts trade that day and 3 lakh call contracts trade, PCR = 1,00,000 ÷ 3,00,000 = 0.33. This low value shows strong buying interest in calls.
Volume PCR captures short-term shifts from news or events. View NSE for better insights. Track them daily to understand mood changes.
PCR Based on Open Interest vs Volume
Aspect | Open Interest PCR | Volume PCR |
|---|---|---|
Definition | Ratio of total outstanding put contracts to call contracts at day’s end. | Ratio of put contracts traded that day to call contracts traded. |
Formula | Total Put OI ÷ Total Call OI | Total Put Volume ÷ Total Call Volume |
Time Focus | Longer-term positions are held overnight. Builds slowly over days. | Short-term activity from one trading session. Resets daily. |
Sensitivity | Changes gradually. Shows sustained sentiment. | Reacts fast to news or events. Captures fresh trades. |
Best Use | Spot multi-day trends or expiry buildup in Nifty options. | Intraday decisions or quick mood shifts. |
Takeaway: Use Open Interest PCR to understand overall market positioning (longer-term view). Use Volume PCR to gauge daily trading activity (short-term view).
How to Interpret PCR Values?
PCR values help you read market mood. The number shows if traders fear a price fall or hope for a price rise. Traders often use 1 as a benchmark value.
- PCR above 1 (like 1.2 or more): Traders buy more put options than call options for protection against price drops. This reflects caution in the market. However, when PCR exceeds 1.5, excessive fear often signals a potential rise.
- PCR below 1 (like 0.8 or less): Traders buy more call options than put options to profit from price increases. This indicates confidence. Yet when PCR falls below 0.5, over-optimism may lead to a market decline.
- PCR near 1 (0.9 to 1.1): Put and call trading remains balanced. The market shows neutral sentiment with no strong directional bias.
PCR Divergence Strategy
Use PCR divergence to spot weak moves and likely reversals. Look for a mismatch between price action and PCR direction.
Divergence Type | What Happens | Trade Signal |
Price rising + PCR rising | Nifty rises 2% to 25,000, but PCR jumps from 0.8 to 1.2 | Possible Sell Signal – Rising PCR with rising price may signal weakness |
Price falling + PCR falling | Nifty falls 1% to 24,500, but PCR drops from 1.3 to 0.9 | Possible Buy Signal – Falling PCR with falling price may signal a bounce |
Flat Price + Extreme PCR | Nifty stays 24,800 (±50 pts) but PCR hits 1.6 | Watch for Breakout – Extreme PCR with flat price may lead to a big move |
Real-Life Example:
- Budget 2026 (Jan 31) – Nifty fell 593 points on Budget day. PCR dropped to 0.43 (very low). Price dropped hard, but traders bought a few puts, showing no real fear. The next day, Nifty rose 2%, indicating a possible short-term reversal.
- RBI Policy Apr 2025 – Price stayed steady, but PCR moved higher as traders bought more puts. Too much fear meant bounce coming. Nifty gained 3% over 4 days.
How Traders Use the Put-Call Ratio?
Traders use PCR to check market mood and time their trades. They look at it daily on NSE for Nifty or Bank Nifty. It helps spot fear or hope before price moves.
- With trends – If Nifty rises while PCR stays low (below 0.7), it may support bullish sentiment.
- At extremes – A high PCR (above 1.3) during a fall may indicate excessive fear and a possible short-term bounce.
- With charts – A very low PCR (below 0.5) near resistance may signal overconfidence and a potential slowdown.
Note: PCR is not a standalone signal. Always combine it with price action, technical levels, and proper risk management before taking any trade.
Limitations of Put-Call Ratio (PCR)
- Mixed Trader Actions – PCR mixes trades from big funds hedging, retail speculators, and others. This can hide the true market mood and give false signals.
- End-of-Day Data Only – NSE updates official PCR only after day’s end, based on final open interest. It misses rapid intraday swings from news or events, limiting live trading use.
- Best for Indices – PCR works best for high-volume indices like Nifty or Bank Nifty. It is less reliable for individual stocks with limited options activity, where isolated trades can disproportionately distort the ratio.
- Fails in Strong Trends – Strong uptrends or downtrends can keep extreme PCR levels going. For example, readings above 1.5 or below 0.5 may last without any reversal. The ongoing trend simply overpowers the sentiment signal.
- Distorted Near Expiry – Heavy position closing and rollovers happen near weekly or monthly expiry. These cause fake spikes in PCR. The changes have nothing to do with true market direction. The effect worsens in the final few days.
Conclusion
The Put-Call Ratio (PCR) is not just a number, it is a reflection of market positioning and sentiment. Rather than predicting exact price movements, it helps identify extremes in fear and optimism, which often precede important turning points. With consistent use, PCR can help you better understand market behavior and make more informed trading decisions over time.
Start small, track trends over days, and always set a stop-loss. PCR sharpens your edge in Nifty options trading. Practice now to read market mood like a pro.
FAQs
A PCR between 0.7 and 1.3 is normal for Nifty. Above 1.3 shows fear, below 0.7 shows greed. Track your own 10-day average for better signals.
Use both. Volume PCR shows short-term mood from that day’s trades. Open interest PCR shows longer bets traders hold overnight. Check NSE for both.
See it free on the NSE India website or apps like Alice Blue. They update at market end and show charts for Nifty and Bank Nifty options.
PCR works best for big indices like Nifty or Bank Nifty with high trade volume. It is less reliable for single stocks due to low activity.
No, PCR is a mood tool, not a sure predictor. Strong news or trends can override it. Always pair with price charts and set a stop-loss.
Check at 9:30 AM, 12 PM, and 3 PM during market hours. Track daily close for trends over 3-5 days. Avoid expiry days with high rolls.

Blog by Aliceblue News Desk


