
Relative Strength RS Rating Explained: How to Use It to Pick Better Stocks in India
Blog by Aliceblue News Desk
04 June 2026
11 minutes
Here is something most beginners overlook. Last year, your stock went up 14%. Sounds decent, right? But the Nifty 500 rose 21% in the same period. That means you held a stock that actually lost ground against the market, even though your portfolio showed a gain.
This is the exact problem the Relative Strength RS Rating solves. It does not just tell you whether a stock rose. It tells you whether a stock rose more than the market. For Indian traders trying to build a focused watchlist from thousands of NSE and BSE stocks, RS Rating is one of the most practical filtering tools available. By the end of this article, you will know what it is, how it is calculated, how to find it on Indian platforms, and how to use it in your stock selection process.
What Is RS Rating?
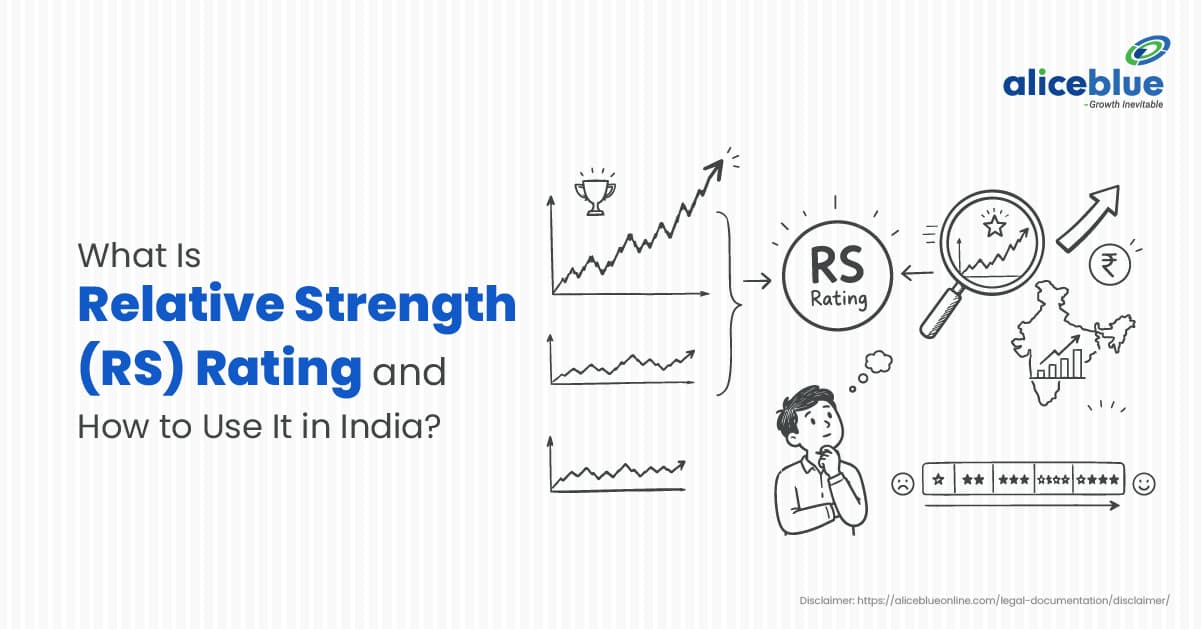
RS Rating is a percentile score between 1 and 99 that measures a stock’s price performance over the past 12 months compared to every other stock in a chosen benchmark index.
A score of 90 means the stock outperformed 90% of all stocks in that index over the last year. A score of 30 means it trailed 70% of the market. The higher the number, the stronger the stock’s price momentum relative to its peers.
The concept was developed by American investor William O’Neil and became central to the CAN SLIM stock picking methodology. In India, the same logic has been adapted for indices like the Nifty 500, Nifty Smallcap 250, and BSE 500 through platforms like MarketSmith India, TradingView, and ChartAlert.
One thing to get clear from the start: RS Rating is not the same as RSI or Relative Strength Index. RSI is a momentum oscillator that compares a stock’s recent gains against its recent losses on a 0 to 100 scale. RS Rating compares one stock’s 12-month price performance against all other stocks in the market. They measure completely different things.
How RS Rating Is Calculated
Most RS Rating tools use a weighted 12-month price performance model. Here is how it works:
- Calculate price returns — Measure how much each stock in the benchmark has moved over the past 12 months.
- Apply weighting — The most recent 3 months of performance carry more weight than the prior 9 months. This means a stock that has recently started accelerating will see its RS Rating climb faster than one with slow, steady gains.
- Rank all stocks — Every stock in the index gets ranked from lowest to highest based on this weighted return.
- Convert to a percentile score — A stock outperforming 85% of all stocks scores an RS Rating of 85.
- Update continuously — RS Ratings change as prices move, so the leaderboard shifts in real time.
One important nuance: different platforms use different time windows. MarketSmith India uses a 12-month weighted model. StockEdge calculates RS over a 55 trading day window, which means it reacts faster to recent price moves. Knowing which platform you are using helps you interpret the score correctly.
The key insight is that RS Rating captures relative performance, not absolute returns. A stock that rose 8% when the market fell 12% may carry a very high RS Rating, even though its absolute return was modest
The RS Line and Why It Matters
Alongside the RS Rating number, most charting platforms show an RS Line. This is a line plotted on the stock’s price chart that represents the ratio of the stock’s price to the benchmark index price over time.
When the RS Line is rising, the stock is outperforming the index. When the RS Line is falling, the stock is underperforming even if its price is going up. When the RS Line makes a new high before the stock’s price makes a new high, that is one of the strongest signals momentum traders look for. It means the stock is quietly building leadership before the actual price breakout happens.
On TradingView, the RS Line status also shows whether the line is at a 52 week high, which adds another layer of confirmation when evaluating a stock setup.
A Real Example: Applying RS Rating in India
Consider the defence sector rally in India between April 2023 and March 2024. Stocks like Bharat Electronics and Hindustan Aeronautics delivered price returns of 100% and above during this period, while the Nifty 500 returned approximately 30% over the same window. Any trader screening for Nifty 500 stocks with RS Ratings above 85 at the start of that period would have had both names near the top of their list.
Now contrast that with many mid cap IT stocks during the same period. They posted modest 10 to 15% returns while the broader market ran ahead. Their RS Ratings would have sat in the 35 to 50 range, signalling underperformance even though the stocks were technically in positive territory.
This is the practical value of RS Rating. It tells you where institutional money is flowing, not just which stocks have a positive return. A trader watching RS Ratings in early 2023 would have shifted attention toward defence and capital goods well before the news cycle caught up with those sectors.
How to Find RS Ratings for Indian Stocks
MarketSmith India
Log in and open any stock page. The RS Rating is displayed alongside EPS Rating and other CAN SLIM metrics. Use pre built screens like Stocks with RS Rating above 90 to filter your watchlist quickly. The RS Line is drawn in blue on every MarketSmith India chart and tracks performance versus BSE 500.
TradingView via Alice Blue
Alice Blue gives you free access to TradingView charts. In the Indicators section, search for RS Rating for Indian Market and apply it to any stock. Select Nifty 500 as your benchmark for mid and large cap stocks and Nifty Smallcap 250 for small caps. The indicator displays the RS Rating score and RS Line directly on the chart.
Screener.in
Go to the Screens section and search for community screens labelled Relative Strength or IBD RS. These screens filter stocks by computed RS scores and are updated regularly.
ChartAlert
Open any stock chart and enable the RS Line overlay. ChartAlert also provides a weekly updated RS Rating score for Indian stocks across major indices.
Applying RS Rating at the Sector Level
RS Rating is not limited to individual stocks. You can use it to track which sectors are outperforming the broader market at any given time.
StockEdge provides pre-built sector-level RS scans with categories like Strongly Outperforming Benchmark and Increasing RS Benchmark. These show you which sectors are attracting buyers and which are losing momentum, all based on the same relative performance logic.
For example, if Nifty PSU Banks as a group are outperforming the Nifty 500 over the past 12 months, the sector RS is high. If Nifty IT is underperforming, its sector RS will be low. Traders who follow sector rotation strategies use this information to increase exposure to sectors gaining momentum and reduce it in sectors that are fading.
The process works the same way as an individual stock RS. Compare the sector index return against the Nifty 500 return over 12 months, assign a percentile rank, and you have a sector-level RS score.
Key Features of RS Rating
- Scale of 1 to 99, where a higher score means the stock is outperforming a larger percentage of the market
- Based on 12 months of weighted price performance, with recent months carrying more influence
- Benchmark relative, so the score depends on the index you compare against
- Updated continuously as prices change, not just at month’s end
- Paired with the RS Line, which shows whether a stock’s relative leadership is building or fading over time
Advantages of Using RS Rating
- Filters market leaders from laggards quickly. Screen for RS above 85 and you are already working with a short list of stocks where institutional buying has been strongest
- Reflects where institutional money is going. Stocks with rising RS Ratings are typically seeing sustained buying from mutual funds and foreign institutional investors, not just retail activity
- Works across market caps when you match the right benchmark. Nifty 500 for mid and large caps, Nifty Smallcap 250 for small caps
- Useful for sector rotation. Helps identify which sectors are gaining traction before broader market attention arrives
- Simple to interpret. A single number gives you a clear relative standing, which is why both beginners and experienced traders use it as a first filter
Risks and Limitations
- It is backward looking. RS Rating tells you what a stock has already done over 12 months. It says nothing about whether that momentum continues.
- Not a valuation check. A stock with RS Rating 95 can still be expensive. Always look at earnings quality and valuations alongside RS.
- Can mislead in a bear market. During a falling market, even a stock with RS Rating 80 may be declining in price, just less than others. High RS does not mean the stock is safe to buy.
- Benchmark selection matters. Comparing a small cap stock to the Nifty 50 will inflate its RS Rating. Always match the benchmark to the stock’s category.
- Works best alongside price action. RS Rating should confirm a strong chart setup, not replace it. A high RS Rating on a broken chart is not a buy signal.
RS Rating vs RSI: Side by Side
Feature | RS Rating | RSI Relative Strength Index |
What it measures | Stock vs other stocks in an index | Stock vs its own recent price history |
Scale | 1 to 99 | 0 to 100 |
Typical time frame | 12 months weighted | 14 days |
Purpose | Stock selection and ranking | Identifying overbought or oversold levels |
Developed by | William O’Neil CAN SLIM | J. Welles Wilder |
Best used for | Building a watchlist of leaders | Timing entries and exits |
Many traders use both together. RS Rating to decide which stock to trade. RSI to help decide when to enter.
Common Mistakes Beginners Make
Treating the RS Rating as a buy signal on its own
A high RS Rating means a stock has been strong relative to the market. It does not mean it is about to go higher. Always combine it with a sound chart setup and volume confirmation.
- Using the wrong benchmark: If you compare a small-cap stock to the Nifty 50, it will almost always look strong because small caps move faster than large caps during bull markets. Use Nifty Smallcap 250 for small caps and Nifty 500 for the broader universe.
- Ignoring the direction of the RS Line: The RS Rating number gives you a snapshot. The RS Line gives you the trend. A stock with an RS Rating of 78 that has been falling from 91 over the past three months is losing momentum. That matters more than the current number.
- Chasing stocks with very high RS Ratings without a base: Stocks that have already run 80 to 100% tend to have very high RS Ratings. Buying them without a proper consolidation base significantly increases risk. The better opportunity is often in stocks building their RS Rating from 60 to 80 while forming a tight chart structure.
- Buying during a market downtrend: RS Rating loses most of its usefulness when the broader market is falling. A rising stock in a falling market can still reverse hard. Always confirm the market trend before acting on an RS signal.
Who Should Use RS Rating
Good fit:
- Momentum traders who want a systematic way to focus on leading stocks
- Swing traders and positional traders looking for stocks with strong institutional backing
- Growth investors following CAN SLIM style strategies
- Beginners who want one clear filter to cut their watchlist down to stocks that are actually gaining ground
Less useful for:
- Value investors specifically targeting beaten down or undervalued stocks, as these will naturally carry low RS Ratings
- Dividend focused investors where consistent income matters more than price outperformance
- Intraday traders where 12 month performance has no relevance to a trade lasting minutes or hours
Conclusion
Most beginners spend time asking whether a stock is good without first asking whether it is better than the market. RS Rating forces that comparison. It filters your attention toward stocks that are actually leading, not just moving.
In India’s market, where thousands of stocks are listed across NSE and BSE, that kind of filtering is necessary. Use RS Rating to build your initial watchlist. Use the RS Line to track whether that leadership is building or fading. Combine both with chart setups and a basic check on fundamentals before placing any trade.
If you want to start tracking RS Ratings on live Indian market data, open a free account on Alice Blue. You get direct access to TradingView charts with RS Rating indicators that you can apply across Nifty 500 stocks today.
Frequently Asked Questions
Most momentum traders look for stocks with an RS Rating of 80 or above. For high-conviction setups, many prefer 85-95. Anything below 70 generally signals that the stock is lagging the broader market.
No, they are completely different tools. RS Rating ranks a stock against all other stocks based on 12-month price performance. RSI is a short-term oscillator that indicates whether a stock is overbought or oversold based on its recent price movements.
You can find RS Ratings on MarketSmith India, TradingView through your Alice Blue account, Screener.in via community screens, and ChartAlert. Use the Nifty 500 as the benchmark for most mid and large-cap stocks.
Not necessarily. RS Rating tells you the stock has been outperforming the market. It does not predict future price movement. Always use it alongside chart analysis and the overall market trend before making any trading decision.
Use the Nifty 500 for mid and large-cap stocks. For small caps, Nifty Smallcap 250 gives a more accurate comparison. Matching the right benchmark ensures you are ranking the stock against its true peer group.

Blog by Aliceblue News Desk


