Volume and Volume Profile Indicator: Meaning, Difference, and How to Use Them
Blog by Aliceblue News Desk
26 October 2026
11 minutes
A stock breaks above resistance. Is that breakout supported by strong trading activity, or is price moving without much participation? This is where volume becomes useful.
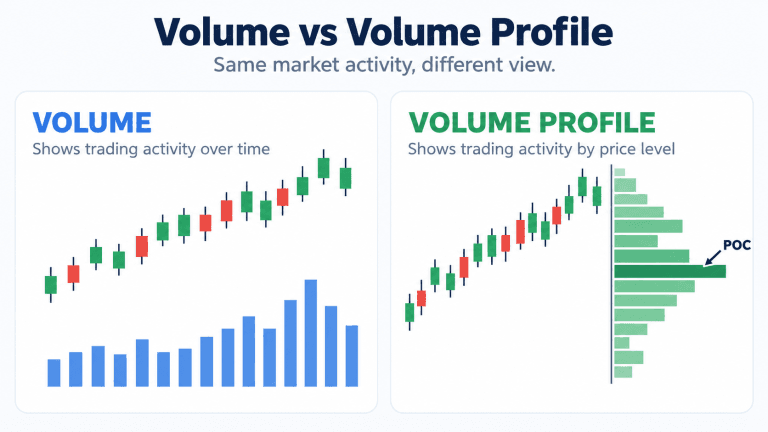
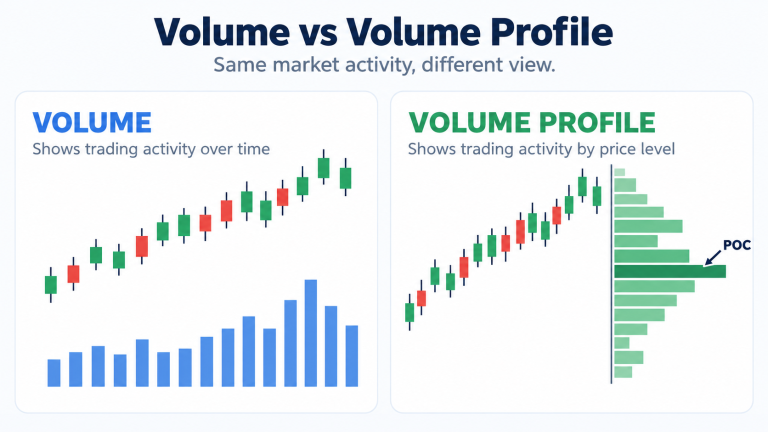
Volume shows how much trading took place during a particular period, while Volume Profile shows where that activity was concentrated across different price levels. In simple terms, Volume tells you how much traded over time, while Volume Profile tells you how much traded around different prices.
Both indicators can help traders understand market participation, but neither can predict where price will move next.
Quick Answer
The Volume indicator shows how much of a security traded during a selected period. For stocks, this usually means the number of shares traded. The Volume Profile indicator shows how that activity was distributed across price levels.
The main Volume Profile levels are the Point of Control (POC), Value Area High (VAH), Value Area Low (VAL), High Volume Nodes (HVNs), and Low Volume Nodes (LVNs). Traders use these areas to understand where the market previously showed more or less trading activity and to study breakouts, consolidation, and possible support or resistance zones.
Table of Contents
- What Is Volume?
- How Do Traders Read Volume?
- What Is Volume Profile?
- Volume vs Volume Profile
- POC, VAH, VAL, HVN and LVN
- How Traders Use Volume Profile
- Practical Example
- Types of Volume Profile
- Important Index Volume Warning
- Common Mistakes
- Conclusion
- FAQs
What Is Volume in Trading?
Volume measures how much of a financial instrument traded during a particular period. For stocks, it usually represents the number of shares traded, while for futures it represents the number of contracts traded.
On most charts, volume appears as vertical bars below the price candles. On a daily chart, each bar represents one trading day. On a 15-minute chart, each bar shows the trading activity during those 15 minutes.
For example, imagine a stock trades 4 lakh shares on Monday, 6 lakh on Tuesday, and 20 lakh on Wednesday. Wednesday clearly had much higher participation than the previous two days.
Volume does not tell you whether price must rise or fall. It simply tells you how much trading activity took place. SEBI’s investor education material also describes technical analysis as the study of price movements, trends and trading volumes, while making it clear that technical tools should be understood as part of a broader investment or trading process. SEBI: Technical Analysis vs Fundamental Analysis
How Do Traders Read Volume?
Volume becomes more useful when you compare it with price movement.
Suppose a stock has repeatedly failed to move above ₹500. It finally closes above ₹500 while trading volume is much higher than its recent average. Traders may see that breakout as having stronger participation because more market activity accompanied the move.
If the same breakout happens on unusually low volume, the move may receive less confirmation. That does not automatically mean the breakout will fail, but it suggests there was less participation behind it.
The same idea applies to falling prices. A sharp decline accompanied by high volume shows heavy activity during the sell-off. However, high volume is not always bullish or bearish. It can appear during strong trends, reversals, panic selling, or exhaustion.
For that reason, traders usually treat volume as confirmation or context, rather than as a standalone buy or sell signal. Alice Blue’s guide to intraday trading indicators and VWAP follows the same approach by showing how price, VWAP and volume can be read together instead of treating one indicator as an automatic trading signal.
What Is Volume Profile?
Traditional volume organises trading activity by time, while Volume Profile organises it by price.
Instead of appearing only below the chart, Volume Profile usually appears as a horizontal histogram beside the price scale. It shows which price areas attracted the most trading activity and which areas saw relatively little activity.
Suppose a stock trades between ₹90 and ₹110. The profile may show light trading around ₹91 to ₹94, heavy activity around ₹99 to ₹102, and lighter activity again near ₹108 to ₹110.
That immediately tells you that much more trading happened around ₹100 than near the edges of the range.
Volume vs Volume Profile
Feature | Volume | Volume Profile |
Organises activity by | Time | Price |
Display | Vertical bars | Horizontal histogram |
Main question | When was activity high? | At what prices was activity high? |
Common use | Confirm trends and breakouts | Study important price zones |
Predicts direction? | No | No |
The two indicators use related market information, but they show it from different perspectives.
POC, VAH, VAL, HVN and LVN
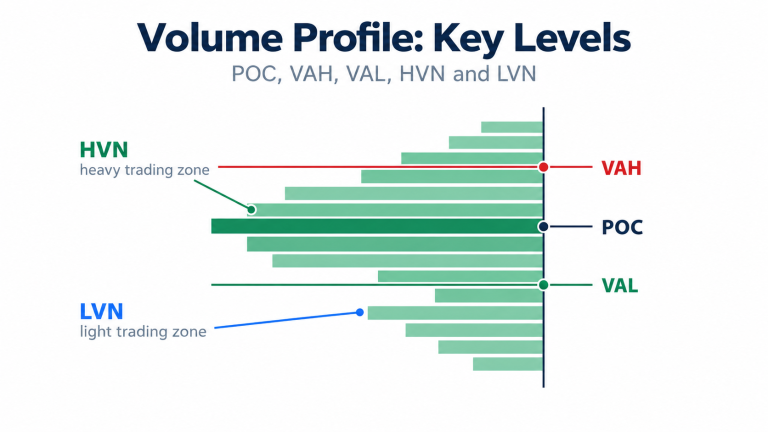
The Point of Control, or POC, is the price level or profile row where the highest amount of volume was recorded within the selected range. If a stock traded between ₹100 and ₹120 and the heaviest activity occurred around ₹108, that area would become the POC.
Traders often pay attention to the POC because it shows where the market previously conducted the most business. However, it should be treated as a reference area, not as guaranteed support or resistance.
The Value Area is the price range containing a chosen percentage of the profile’s total volume. A common setting is around 70%, although this can be adjusted depending on the platform. The upper boundary is called Value Area High (VAH) and the lower boundary is called Value Area Low (VAL). Together, they show the area where most of the trading activity took place during the selected range.
- A High Volume Node, or HVN, is a price area where relatively heavy trading occurred. These zones often form when price spends time consolidating and buyers and sellers repeatedly trade around similar levels.
- A Low Volume Node, or LVN, is an area where relatively little trading took place. These zones often appear when price moved quickly through a range instead of spending much time there.
Traders sometimes watch HVNs for possible reactions and LVNs for faster movement, but these are historical observations rather than fixed rules.
How Do Traders Use Volume Profile?
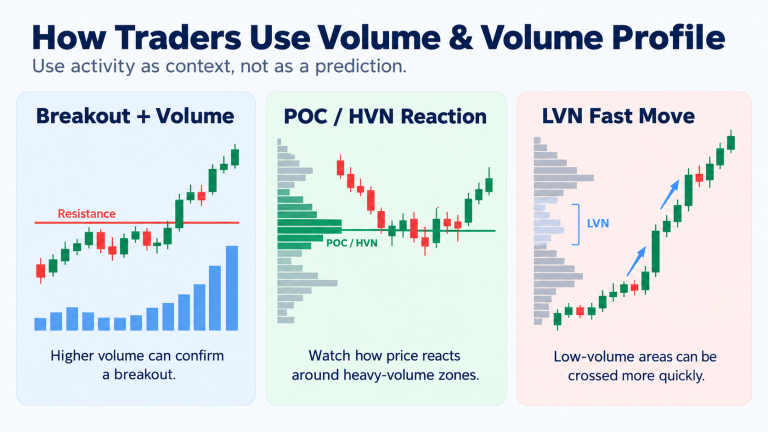
One common use of Volume Profile is identifying price areas worth watching for possible support or resistance. If a large HVN lies below the current price, a trader may watch that zone when price returns to it. If buyers begin to respond there, the area may support the trade idea. If price moves through it easily, the historical volume zone has not held.
Volume Profile can also help with breakout analysis. Suppose a stock breaks above ₹1,000 with strong ordinary volume. If the profile shows relatively little historical activity immediately above that level, a trader may see additional evidence that price is leaving an old trading range.
This is where understanding ordinary chart levels becomes useful. Alice Blue’s beginner guide to support and resistance trading explains how traders identify areas where price has reacted previously. Volume Profile can add another layer by showing how much trading activity occurred around those same zones.
Another use is understanding consolidation. A large HVN can show where price spent more time trading repeatedly, while an LVN can show where price previously moved through more quickly.
Volume Profile is generally more useful when combined with price action, market structure, support and resistance, VWAP, or other tools rather than used on its own.
Practical Example
Suppose a stock has traded between ₹900 and ₹1,000 over the past few weeks. Its Volume Profile shows a POC near ₹950, VAH at ₹970, VAL at ₹930, a large HVN between ₹945 and ₹955, and an LVN between ₹975 and ₹985. The current price is ₹965.
- If price falls toward ₹950, a trader may watch whether the POC and HVN area attracts fresh buying. A rejection from the zone, improving volume, or a reversal pattern may add support to the trade idea.
- If price instead moves above ₹970, the trader may watch whether it can remain above the previous Value Area. The nearby LVN between ₹975 and ₹985 can also provide context because relatively little historical trading took place there.
The main purpose of these levels is to show where to pay attention, not to generate an automatic buy or sell signal.
Main Types of Volume Profile
- The Fixed Range Volume Profile lets you manually select the beginning and end of the market move you want to study. Traders may use it for a rally, decline, consolidation, or individual swing.
- The Visible Range Volume Profile, often called VPVR, uses only the part of the chart currently visible on the screen. If you zoom in, zoom out, or move the chart, the profile changes.
- The Session Volume Profile creates a separate profile for each trading session and is commonly used by intraday traders.
Beginners usually do not need more complicated versions until they are comfortable with these basic types.
Important: Index Volume Is Different From Stock Volume
This point is especially important for Indian traders. A stock such as Reliance Industries directly trades on an exchange, so its volume represents actual shares traded. An index such as the Nifty 50, however, is calculated from its constituent stocks and does not itself trade like a share.
On some platforms, including TradingView, Volume Profile on an index can use tick volume, which reflects the number of price updates rather than actual traded shares or futures contracts.
So a Nifty spot Volume Profile should not automatically be treated as real exchange-traded volume. If actual traded volume is important to your analysis, traders often look at the relevant futures contract instead, while remembering that futures and the spot index are not exactly the same instrument.
For derivatives traders, ordinary volume also needs to be distinguished from Open Interest (OI). Volume measures how many contracts traded during the session, while OI measures how many contracts remain open. Alice Blue’s guide to Open Interest and Volume in options trading explains that distinction in more detail.
Are Green and Red Volume Bars Buyers and Sellers?
Not exactly. Every completed trade has both a buyer and a seller. A green bar does not mean only buyers were active, and a red bar does not mean only sellers were active.
On some platforms, including TradingView, up and down volume is estimated using the direction of lower-timeframe price bars rather than true buyer-versus-seller intention.
Different platforms can use different calculation methods, so it is important to understand how your charting platform defines volume before interpreting the colours.
Common Mistakes
One common mistake is treating the POC as guaranteed support or resistance. It only shows where the highest amount of volume occurred in the selected range, and price can still move straight through it.
Another mistake is assuming high volume is always bullish. High volume simply means increased activity and can occur during both strong buying and strong selling.
Some traders also adjust the start and end points of a Fixed Range Volume Profile until the levels fit their existing view. The selected range should represent a logical market move, consolidation, or swing rather than being chosen only to confirm a bias.
It is also important to understand the type of volume data being used. Stock trade volume and index tick volume are not the same thing.
Finally, Volume Profile should not be used in isolation. SEBI’s investor guidance reminds market participants to understand their risk appetite and the possibility of market and volatility losses before investing or trading in securities. SEBI: Key Risks in the Securities Market
Tips for Beginners
Start by understanding ordinary volume before moving to Volume Profile. Once you are comfortable with basic volume, focus first on POC, VAH, and VAL rather than trying to learn every setting at once.
Treat important Volume Profile levels as zones rather than exact turning points, and watch how price behaves when it reaches them. Use logical start and end points for Fixed Range Volume Profile, and check whether your platform is using actual traded volume or another data source such as tick volume.
Most importantly, decide your risk before entering a trade. A useful technical level does not replace a stop-loss or proper position sizing.
Conclusion
Volume and Volume Profile show market activity from two different angles. Normal volume tells you how much trading occurred during each period, while Volume Profile shows where that activity was concentrated across different price levels.
POC, VAH, VAL, HVNs, and LVNs can help traders identify areas worth monitoring, while normal volume can add context to trends and breakouts.
Neither indicator predicts price direction or guarantees support and resistance. Their real value comes from helping traders understand market activity and combine that information with price action and risk management.
Frequently Asked Questions
Volume measures how much of a financial instrument is traded during a particular period. For stocks, it usually represents the number of shares traded.
Volume Profile shows how trading activity was distributed across different price levels during a selected period.
POC stands for Point of Control. It is the price level or profile row where the highest amount of volume occurred within the selected range.
VAH and VAL are the upper and lower boundaries of the Value Area. A common setting includes around 70% of the profile’s total volume.
An HVN is a price zone with relatively high historical volume, while an LVN is an area where comparatively little trading took place.

Blog by Aliceblue News Desk