
What Is Open Interest in Options? How to Use OI Data for Trading
Blog by Aliceblue News Desk
20 April 2026
12 minutes
Every Tuesday, millions of traders in India open the NSE option chain and ask the same question: where is Nifty actually headed? Price gives you one clue. Volume gives you another. But there is a third number sitting right there in the option chain that most beginners completely ignore. That number is open interest.
Open Interest tells you how many contracts are genuinely alive in the market at any given moment. It only counts what is still active and unsettled. When you read OI alongside price, you stop guessing and start seeing what large traders are actually doing. This article explains how OI works, how to read it using real Indian market scenarios, and how to apply it in your trading.
What Is Open Interest in Options?
Open Interest is the total number of active options or futures contracts that have not yet been closed, squared off, or exercised. Each unit of OI represents one live contract with one buyer on one side and one seller on the other.
If 500 traders hold open Call positions on Nifty’s 23,000 strike and 500 traders have sold those Calls, the OI at that strike is 500, not 1,000. Each contract always has two sides. The moment either side closes its position, OI drops. When a new trader enters a fresh position, OI rises.
NSE publishes OI data in the option chain for every expiry and every strike, free to access on the NSE India website. The data refreshes every 3 minutes during live trading hours, not on every tick.
How Open Interest Moves: A Day-by-Day Example
Let us build this from scratch using two traders, Rahul and Priya, trading Nifty 50 options over four days.
Add Your Heading Text Here
Day 1
Rahul buys 1 Nifty 23,000 Call. Priya sells it to him as a completely fresh position. Both are entering the market for the first time at this strike.
OI moves from 0 to 1
Day 2
A third trader, Suresh, buys 2 Nifty 23,000 Calls. Two new sellers take the other side. All positions are fresh.
OI moves from 1 to 3
Day 3
Rahul books a profit and exits his 1 contract. Anita, a new trader, buys that contract from Rahul. Priya still holds her short position. One position changed hands, but nothing was closed or created.
OI stays at 3
Day 4
Priya buys back her short position to exit. The buyer she sells to is Suresh, who is also closing one of his two long positions. Both sides close simultaneously.
OI drops from 3 to 2
Day | Action | OI |
Day 1 | Rahul buys; Priya sells fresh | 1 |
Day 2 | Suresh buys 2; two new sellers enter | 3 |
Day 3 | Rahul exits to Anita (transfer only) | 3 |
Day 4 | Priya and Suresh both close 1 contract each | 2 |
The rule is straightforward. OI rises when new positions are created. OI falls when existing positions are closed. OI stays flat when a position transfers from one trader to another.
Long Buildup, Short Buildup, Long Unwinding, Short Covering
These four terms form the core language of OI analysis in India. Every options trader uses them. Once you understand them, reading the option chain becomes significantly clearer.
Long Buildup
Price rises and OI rise together. Fresh buyers are entering the market and building new positions. The upward move has real participation behind it. This is the clearest bullish signal OI can give you.
Short Buildup
Price falls and OI rises together. Fresh sellers are entering and adding new short positions. The downward move is backed by new conviction, not just old buyers exiting. This is a genuine bearish signal.
Long Unwinding
Price and OI fall together. Traders who were holding long positions are now exiting. The selling comes from buyers leaving, not from new sellers entering. These moves can lose momentum quickly.
Short Covering
Price rises and OI fall together. Short sellers are buying back their positions to close out. The price goes up, but no new money is entering the market. These rallies frequently fade.
Price | OI | Signal Name | Meaning |
Rising | Rising | Long Buildup | Fresh buying, bullish |
Falling | Rising | Short Buildup | Fresh selling, bearish |
Falling | Falling | Long Unwinding | Longs exiting, weak bearish |
Rising | Falling | Short Covering | Short-term closing, weak bullish |
Before entering any trade, check which of these four situations is active. It tells you immediately whether the move has conviction or is running out of fuel.
Put Call Ratio: What It Tells You and How to Read It
The Put-Call Ratio (PCR) is calculated directly from OI data and is one of the most tracked indicators by Indian options traders. The formula is:
PCR = Total Put OI divided by Total Call OI
Example: If the total Put OI on Nifty across all strikes is 80 lakh contracts and the total Call OI is 60 lakh contracts, the PCR is 80 divided by 60 = 1.33
How to read PCR:
- PCR above 1.2: More Put positions are open than Call positions. This typically acts as a bullish signal as it indicates potential market support
- PCR below 0.8: More Call positions are open than Put positions. This acts as a bearish signal, indicating potential resistance
- PCR between 0.8 and 1.2: Market sentiment is balanced with no strong directional bias
- PCR above 1.5: Extreme reading. Markets tend to be oversold at this level and often signal a potential reversal upward
NSE displays the PCR for Nifty directly on the option chain page. You do not need to calculate it manually.
How to Use OI Data for Trading
Identify Support and Resistance Levels
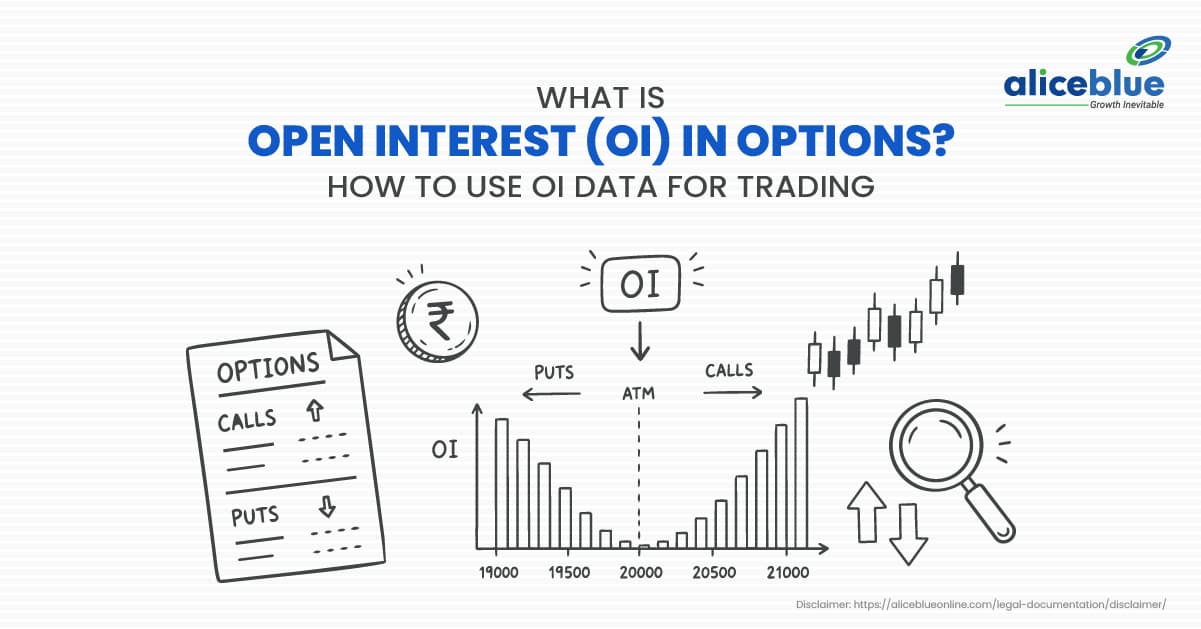
The strike with the highest Put OI is your nearest support zone. The strike with the highest Call OI is your nearest resistance zone. Large option writers actively defend these levels because they have significant money committed there. When reading support and resistance, use the current weekly expiry OI for short-term levels and the monthly expiry OI for positional trades.
Confirm Whether a Trend Has Conviction
Use the four signal framework above before entering any trade. A long buildup confirms the upward move is backed by fresh buying. A Short Covering rally, by contrast, tells you the move may not last because no new buyers are stepping in.
Watch for OI Unwinding Before a Breakout
When OI drops sharply at a dominant Call or Put strike, it usually means large writers are stepping away from that level. This often happens before the price actually breaks through. Watching OI unwind at a key level gives you early warning before the breakout occurs.
Use Max Pain Near Expiry
Max Pain is the expiry price at which option buyers collectively lose the most premium. It is derived from OI across all strikes. For example, if Nifty is at 22,800 but the Max Pain level for Tuesday’s expiry is 22,500, the index has a tendency to drift toward 22,500 in the final one to two sessions. Platforms like Sensibull and Opstra calculate and display Max Pain automatically.
Track the OI Spurts Report on NSE
NSE publishes a daily OI Spurts report on its website showing stocks where OI has jumped significantly in a single session. A stock with a 50 to 100 per cent OI spike in one day is worth monitoring, as it frequently precedes a sharp price move in the days that follow.
OI for Option Writers
Option writers use OI to select their strikes. Strikes with high OI have tighter bid-ask spreads and better liquidity, which makes entering and exiting large positions easier. When writing Covered Calls, Strangles, or Iron Condors, high OI strikes are preferable because they reflect genuine market interest at that price level.
Open Interest vs Volume
Both numbers appear side by side in most option chain views. They measure completely different things.
Feature | Open Interest | Volume |
What it counts | Live, unsettled contracts | Total contracts traded in a session |
Resets daily | No, carries forward | Yes, starts at zero every morning |
What does it tell you | How much capital is still committed | How active trading was today |
Best used for | Trend confirmation and support resistance | Intraday momentum and liquidity |
Volume is the footprint. OI is the weight still on the ground.
A stock can see high volume on a given day while OI falls, meaning traders are churning in and out without building any real positions. Compare that to a stock with moderate volume but rapidly rising OI, where every transaction is creating a new committed position. These two situations call for entirely different trading decisions.
Key Facts About Open Interest
- OI resets to zero at expiry, as all contracts either expire worthless or get exercised
- NSE retained only Nifty 50 as a weekly expiry index, effective November 20, 2024, following SEBI’s directive that each exchange can offer weekly expiry on only one benchmark index
- Bank Nifty, FinNifty, and all other NSE index contracts now expire monthly, on the last Tuesday of each month
- All NSE F&O expiries shifted to Tuesday from September 2025 onwards.
- BSE Sensex contracts continue to expire on Thursdays
- OI data on NSE refresh every 3 minutes during live trading, not on every tick
- High OI at a strike means better liquidity, tighter spreads, and easier exits
Advantages of Tracking Open Interest
- Adds a second layer of confirmation beyond price, which is useful when price action is stuck in a range or giving conflicting signals
- Large institutions cannot build or unwind large positions without leaving OI footprints in the option chain, which retail traders can track and act on
- Completely free and publicly available on NSE for every trader
- Works across trading styles, from intraday to positional trades held over multiple weeks
- PCR, Max Pain, and OI buildup signals all come from this one data source
Limitations to Keep in Mind
- OI alone tells you nothing about direction. High OI at a strike only means there are large open positions, not whether they are bullish or bearish. You always need price direction alongside OI.
- In the final one to two sessions before expiry, large position unwinding and rollover activity create noise. Do not try to read directional signals from OI during this window.
- Because NSE refreshes OI every 3 minutes, it is not suitable as a precision timing tool for scalping. Use it to understand the overall session setup.
- For stocks with low F&O participation, OI numbers are too small to reflect institutional intent. Stick to Nifty 50, Bank Nifty, and the top liquid F&O stocks.
- OI walls break. Heavy Call OI at a strike is a resistance zone, not a guaranteed ceiling. When large writers start unwinding, those levels break fast.
Common Mistakes Beginners Make
- Assuming high OI is a bullish signal
High OI at a strike could represent thousands of Call buyers positioned long or thousands of Call writers positioned short. Both show up as high OI. Direction cannot be read from OI alone. - Using OI without price direction
OI without the four signal framework is just a number. Always pair it with price to determine whether you are looking at a long buildup, short buildup, long unwinding, or short covering situation. - Misreading expiry day OI
On weekly expiry Tuesdays, OI typically falls as traders close or roll positions. This bulk unwinding is not fresh directional positioning. Do not treat it as a market signal. - Ignoring PCR
Reading only one strike in isolation gives a narrow picture. PCR aggregates the entire option chain into a single market-wide sentiment reading that is far more reliable for gauging overall direction.
Trading OI Spurts without context
A sudden OI spike in a stock is worth investigating, not worth acting on immediately. Check whether the spike is in Calls or Puts, whether the price is confirming the move, and what the broader market is doing before placing a trade.
Who Should Use OI Analysis
Options traders benefit most from OI data, whether they are buying outright or writing for a premium. OI indicates where the real stakes concentrate across the option chain.
Futures traders use OI to confirm whether a trend has fresh participation or whether traders are just transferring old positions between themselves.
Positional traders who hold trades for three to seven days use OI to verify whether large players are building positions in the same direction as their trade.
Intraday traders use OI as a background filter to avoid entering trades directly into heavy OI resistance or support walls and to assess whether a breakout has genuine follow-through.
Long-term equity investors buying stocks in the cash market for years do not need OI analysis. It applies specifically to derivatives trading.
OI is a map of where committed money is sitting in the market right now. When you read it alongside price direction using the four signal framework, you can tell whether a move has real conviction or is just the result of old positions being unwound.
Start by opening the NSE option chain for Nifty 50 tomorrow morning. Find the strike with the highest Call OI and the strike with the highest Put OI. Watch what happens when the price approaches either level. Over a few weeks of consistent observation, reading OI becomes an automatic part of how you assess any trade before placing it.
Frequently Asked Questions
Open Interest is the count of all active, unsettled options contracts in the market. Each unit represents one live contract with a buyer and a seller. OI rises when new positions are created and falls when existing positions are closed.
No. High OI at a strike only tells you there are many open positions there. It does not tell you whether those are long or short. Always combine OI with price direction before drawing any conclusion.
A long buildup happens when both price and OI rise together, meaning fresh buyers are entering. Short Covering also pushes the price up, but OI falls because it is driven by short sellers closing their positions rather than new buyers stepping in. A long buildup is a stronger and more sustainable signal.
Following SEBI’s circular effective from September 2025, all NSE F&O contracts now expire on Tuesday. Nifty 50 weekly options expire every Tuesday. Bank Nifty and FinNifty have monthly expiries on the last Tuesday of each month. BSE Sensex contracts expire on Thursdays.
PCR = Total Put OI divided by total call OI across all strikes. A reading above 1.2 signals potential market support and is considered mildly bullish. Below 0.8 signals potential resistance and is considered mildly bearish. A PCR above 1.5 is an extreme reading and often acts as a contrarian signal for a reversal upward.
OI unwinding means existing positions are being closed at a particular strike in large numbers. When OI drops sharply at a dominant Call or Put level, it often signals that the traders defending that level are stepping away, which can precede a price breakout before it actually happens.
Max Pain is the expiry price at which option buyers collectively lose the most premium. It is derived from OI across all strikes. The index has a tendency to drift toward the Max Pain level in the final one to two sessions before expiry. Platforms like Sensibull and Opstra calculate and display the implied volatility automatically.

Blog by Aliceblue News Desk


