
What is Support and Resistance?
Blog by Aliceblue News Desk
02 April 2026
7 minutes
Ever wondered what those jargons that professional traders you see across social media keep talking about? What do those chart screenshots mean?
Ever wish you understood what those meant and how to read a chart and identify future patterns on your own?
Understanding and reading a chart, and trying to make use of it, is what is simply called Technical Analysis. Support and resistance are the foundations of understanding and learning technical analysis.
So, let’s start by exploring what technical analysis generally means.
What is Technical Analysis in Trading?
Technical Analysis simply means the study of past price movements and patterns on a chart to help predict future price trends. Traders use charts, trends, and other indicators, often using a tool called TradingView, through which they make decisions about when to sell or buy or if it’s better to hold.
Throughout this article, we will be using Charts from TradingView to explain different terminologies.
What is Support & Resistance
Analogy
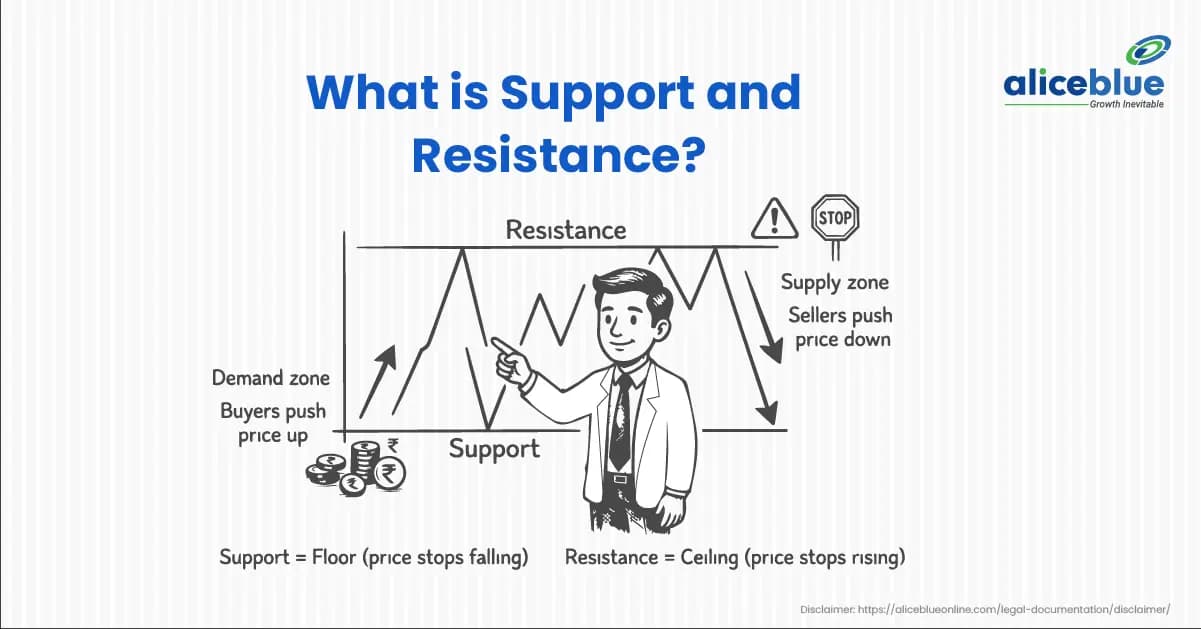
Let’s look at what support and resistance mean by using an analogy like a floor and a ceiling, where the floor represents support and the ceiling represents resistance.
Support: Think of the price of an asset like a ball bouncing inside a room. The floor acts as a support, stopping the ball from falling further down.
Resistance: The ceiling acts as a resistance, preventing the ball from rising further.
Technical Explanation
Support: The support level is a price point on the chart where traders expect strong demand (where buying is strong) for the stock/index. Whenever the price falls to the support line, it is likely to bounce in the opposite direction. The support level is always below the current market price.
Resistance: The resistance level is a price point on the chart where traders expect strong supply (where selling is strong) for the stock/index. Whenever the price rises to the resistance line, it is likely to bounce in the opposite direction. The resistance level is always above the current market price.
Real-Life Example
Let’s take the example of an Unnamed Stock’s Price.
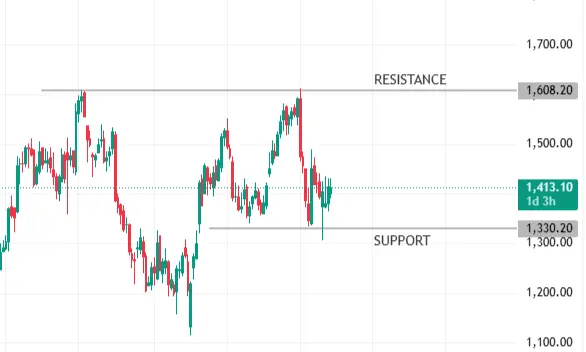
Support: Whenever the price falls to the ₹1,300 range, the buyers are strong, indicating a strong demand.
Resistance: Whenever the price rises to the ₹1,600 range, the sellers are strong, indicating a strong supply.
Why Support and Resistance Matter
Helps in Entry/Exit Positions and Risk Management: It helps traders to have control of their portfolio valuation, helping them decide when to sell during crashes, minimizing losses, and better risk management, as well as when to buy, to maximize profits and be an early buyer if a stock price is undervalued.
Identifying Trends: Falling below a previous support is considered a market downtrend, where fear dominates, while rising above a previous resistance is considered a market uptrend, where greed dominates.
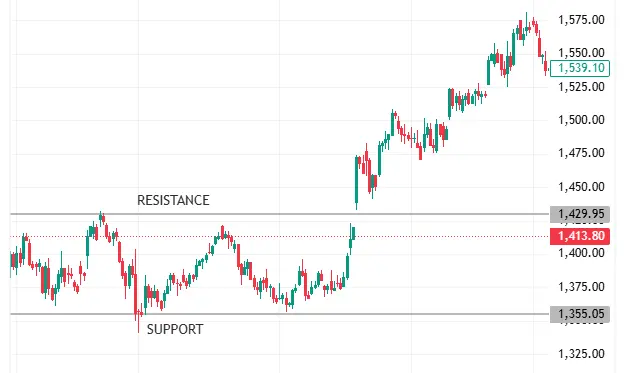
- In the image below: We take a look at the same stock used above, where the price rose above the previous resistance at the price range ₹1,400, which is called “HORIZONTAL BREAKOUT”, in such a case, the price will keep rising, ending the consolidation period, hence moving on to a new high, reaching all the way till ₹1,575.
Types of Support and Resistance
- Horizontal Support & Resistance: Happens at specific price levels where the price keeps repeatedly bouncing within a range between a support and resistance region for a long period of time, until it breaks out of this range.
- Trendline Support & Resistance: Instead of price being bounced within horizontal price ranges, the price moves diagonally until it breaks out of its range.
- Dynamic Support & Resistance: Unlike Horizontal and Trendline, these move automatically and adjust with price using indicators like Moving Averages.
Experienced traders use indicators like 50 EMA, 200 EMA, to name a few, where EMA stands for Exponential Moving Average, and is a technical indicator that calculates the average price over a specific period, used to identify trends faster.
How to Trade Using Support and Resistance
- Buy at Support, Sell at Resistance: When price approaches a support level, traders consider it a buying opportunity, because historically, price has bounced from this region, and when price approaches a resistance level, it may be a good time to sell because the price often struggles to go higher.
- Breakout Trading: A breakout happens when the price breaks above a support or resistance level with strong momentum. Traders often expect the momentum to continue in the breakout direction.=
- Retest Strategy: After a breakout, the price often revisits the broken level to test whether the level still has demand or supply. If the price holds above it, it becomes the new support level and is often considered a good entry point.
Common Mistakes to Avoid
- Treating levels as exact lines: Many beginners make the mistake of assuming support and resistance as exact lines, but in reality, it’s more like a zone, where the price can move slightly above or below the level.
- Ignoring market trends: Support and resistance work best when used alongside the overall trend. For example, buying at a support during a massive crash is risky. Always identify whether the market is in an uptrend, downtrend, or sideways movement before making decisions.
- Not using stop loss: One of the biggest mistakes while trading is not using a stop-loss. A stop-loss limits your losses and protects your capital if the trade doesn’t go as expected, acting as a fundamental for risk management.
Frequently Asked Questions
Many traders place limit buy orders at known support levels, which get executed the moment the price touches, bringing huge volume from investors, naturally pushing the price back up.
Yes, this is called ‘Role Reversal. Once the support level is broken, then it becomes the new resistance. Traders who didn’t sell during the crash often try to break even when the price returns to that level, creating new selling pressure.
Yes, you can find these patterns on a 5-minute chart or a monthly chart. However, higher timeframe levels like daily or weekly charts are generally considered much stronger and more reliable.
A fakeout (false breakout) happens when the price briefly moves above resistance or below support, tricking traders into entering a position, only to reverse sharply and go back to the previous range. This is why most professional traders often wait for a retest before entering.
A legitimate breakout is usually accompanied by a significant spike in volume. If price breaks out on low volume, it’s more likely a trap (often called a bullish/bearish trap)
200 EMA is widely considered the gold standard for long-term investors. When a stock stays above its 200 EMA, it’s generally viewed as being in a long-term uptrend.
Breakouts can indicate strong upward momentum, but it’s important to confirm with volume or a retest of the broken level to avoid fakeouts.
A retest happens after a breakout when the price returns to the previously broken support or resistance. If the level holds, it often becomes a strong entry or exit point.
No, support and resistance are best used alongside other technical indicators and trend analysis to reduce risks and make better trading decisions.
Not always. Highly volatile or illiquid stocks may have less defined levels, making it harder to trade purely on support and resistance.
Traders use stop-loss orders near support or resistance levels to limit losses if the price moves against them, to protect capital, and maintain disciplined trading.
Moving averages act as dynamic support/resistance, especially in trending markets, but these are best used together with horizontal or trendline levels.
Yes, support and resistance are considered a universal concept in technical analysis.

Blog by Aliceblue News Desk


