
Bullish Harami Pattern: Meaning, Example and Trading Setup
Blog by Aliceblue News Desk
16 October 2026
12 minutes
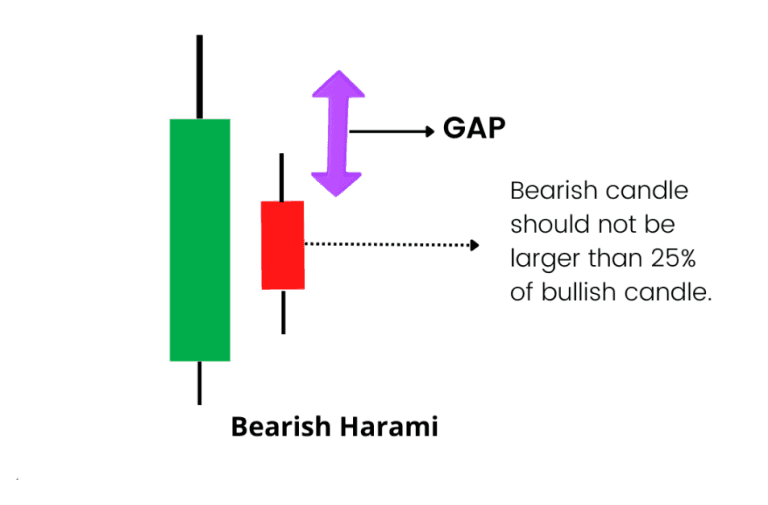
A stock has been falling for several sessions. Then, after one more strong red candle, a small green candle appears inside it. Has the downtrend ended? Not necessarily, but sellers may be losing control.
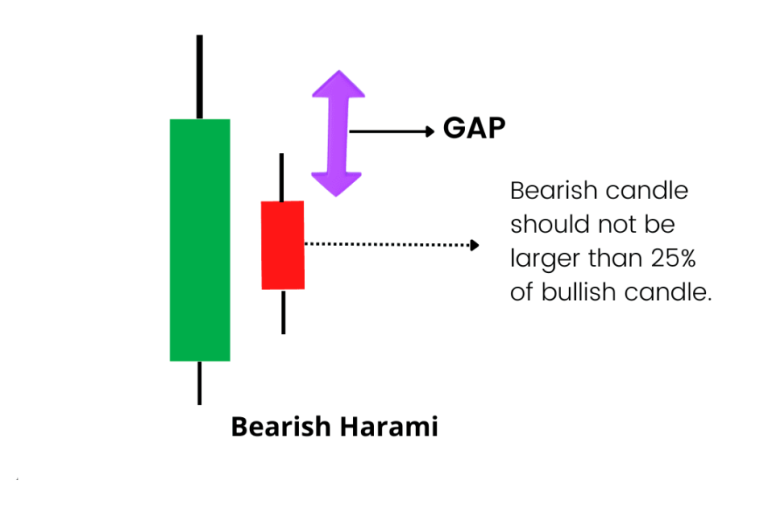
The Bullish Harami pattern is a two-candle formation that appears after a price decline. The first candle is large and bearish, while the second has a small bullish body that sits inside the first candle’s body. Traders read it as an early sign that selling pressure may be easing, not as proof that the price will rise.
Quick Answer
A Bullish Harami is a possible bullish reversal pattern found after a downtrend. It has a large red candle followed by a smaller green candle whose body lies inside the first candle’s body. The pattern becomes more useful when the next candle confirms buying strength and the setup appears near support, with suitable volume and controlled risk.
Table of Contents
- What Is a Bullish Harami Pattern?
- How Does a Bullish Harami Work?
- How to Identify a Bullish Harami
- Real NIFTY 50 Example
- How to Trade a Bullish Harami
- Key Characteristics
- Advantages
- Risks and Limitations
- Tips for Beginners
- Bullish Harami vs Bullish Engulfing
- Common Mistakes to Avoid
- Who Should Use This Pattern?
- Conclusion
- Frequently Asked Questions
What Is a Bullish Harami Pattern?
A Bullish Harami is a two-candle pattern that can appear near the end of a downtrend. It suggests that the pace of selling has slowed and buyers are starting to respond.
Each candle shows four prices for a selected period: open, high, low, and close. The thick part between the open and close is called the real body. Thin lines above or below it are called wicks or shadows.
A textbook Bullish Harami has:
- A clear price decline before the pattern.
- A large bearish candle on the first day.
- A smaller bullish candle on the second day.
- The second candle’s real body fully inside the first candle’s real body.
The wicks need not sit inside the first candle. The real-body relationship is the main test.
The word “Harami” is Japanese for “pregnant”. On a chart, the larger first body appears to contain the smaller second body. The name describes the shape; it does not make the signal certain.
How Does a Bullish Harami Work?
- A downtrend is already in place. Sellers have pushed the price lower. Without a prior decline, there is no bearish trend for the pattern to reverse.bajajfinserv+1
- The first candle closes lower. Its long red body shows that sellers still control the session.
- The second session opens above the first close. The price does not continue sharply downward as sellers expected.
- A small green body forms inside the first body. Buyers recover part of the previous session’s fall, but not all of it.
- The market pauses at a decision point. Selling pressure has weakened, but a pause can still be followed by another fall.
- Traders look for confirmation. A common test is for the next candle to close above the second candle’s high. Some traders use the stricter test of a close above the first candle’s high.tmgm+1
This is why the pattern should be read as an alert, not an automatic buy instruction.
How to Identify a Bullish Harami
Use this checklist before calling two candles a Bullish Harami:
- Trend: The price was making lower highs and lower lows, or had fallen clearly before the pattern.
- Candle 1: A visibly large red body.
- Candle 2: A smaller body, usually green.
- Body position: Candle 2’s open and close both lie within Candle 1’s open-to-close range.
- Location: The pattern appears near the lower end of the recent move, not in a flat range.
- Confirmation: The following candle closes above Candle 2’s high, or meets a stricter rule chosen before the trade.
A small green candle after a long red candle is not enough. If it appears during sideways trading, the formation lacks the downtrend context required for a reversal pattern.
Real NIFTY 50 Example
The NIFTY 50 formed a Bullish Harami on 7 and 8 October 2024 after a decline. This example uses recorded index prices rather than invented values.trackstock+1
Session | Open | High | Low | Close | Reading |
7 October 2024 | 25,084.10 | 25,143.00 | 24,694.35 | 24,795.75 | Large bearish candle |
8 October 2024 | 24,832.20 | 25,044.00 | 24,756.80 | 25,013.15 | Smaller bullish body inside Candle 1 |
9 October 2024 | 25,065.80 | 25,234.05 | 24,947.70 | 24,981.95 | Rose intraday, but closed below Candle 2’s close |
On 8 October, the real body ran from 24,832.20 to 25,013.15. It sat inside the 7 October body, which ran from 24,795.75 to 25,084.10. That satisfies the body-containment rule.
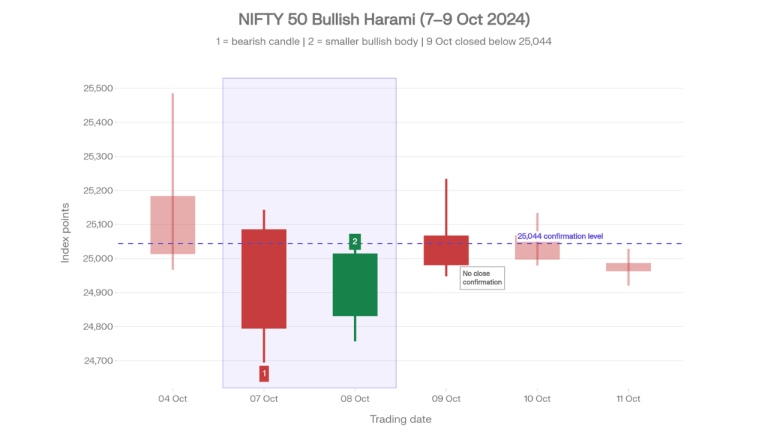
On 9 October, the index traded above the 8 October high of 25,044 and reached 25,234.05, but it closed at 24,981.95—below both the 8 October high and close. Therefore, a trader requiring close confirmation above Candle 2’s high would not have entered. This is a useful example because it shows why an intraday rise and a confirmed closing signal are not the same thing.
How to Trade a Bullish Harami
There is no single entry rule that suits every trader. The main approaches differ in how much confirmation they require.
Entry
- Early entry: Enter near Candle 2’s close. This provides an earlier price but carries more false-signal risk.
- Breakout entry: Enter only if price moves above Candle 2’s high.
- Close-confirmation entry: Wait for the next candle to close above Candle 2’s high. This is slower but shows that buyers held the gain into the close.bajajfinserv+1
- Stricter entry: Wait for a close above Candle 1’s high. This gives stronger price confirmation but may produce a later entry.
Beginners may find a pre-decided close-confirmation rule easier to follow because it removes the pressure to react to every intraday move.
Stop-loss
A common stop-loss is placed below the lower low of the two pattern candles. If price breaks that point below, the expected reversal has failed, and the earlier downtrend may be continuing.
Target
Possible target methods include:
- The nearest resistance level.
- A previous swing high.
- A pre-decided reward-to-risk ratio, provided the chart offers enough room before resistance.
No target method guarantees an exit at the best price.
Risk calculation
Assume a share gives a confirmed entry at ₹505, and the stop-loss is ₹493.
- Risk per share = ₹505 − ₹493 = ₹12.
- Maximum planned trade loss = ₹1,200.
- Position size = ₹1,200 ÷ ₹12 = 100 shares.
This is a calculation example, not a historical stock setup. Brokerage, taxes, slippage, and gaps can make the actual loss different.
Key Characteristics
- Two-candle formation: Both candles are needed; one candle alone cannot form a Harami.
- Needs a downtrend: The pattern has little reversal meaning without a prior fall.
- Small second body: Candle 2 shows that downward momentum has slowed.
- Body containment: Candle 2’s open and close sit inside Candle 1’s open and close.
- Wicks are secondary: They can extend outside the first candle; focus first on the real bodies.
- Possible reversal, not certainty: The pattern may lead to a rise, a sideways move, or another decline.
- Confirmation matters: Support, volume, RSI, and a later bullish close can add context, but none removes risk.
Advantages
- Easy to spot: The two contrasting candle bodies are visually clear once the basic rules are known.
- Shows a change in pace: It alerts traders when strong selling is no longer continuing at the same speed.
- Offers a chart-based invalidation point: The pattern low gives traders a logical level for testing whether the setup has failed.
- Works across chart periods: The same structure can appear on intraday, daily, or weekly charts, although signals on shorter periods may contain more market noise.
- Pairs with other tools: Traders can assess the pattern alongside support, volume, RSI, or moving averages.
Risks and Limitations
- False reversals: The price may pause for two sessions and then resume falling.
- No built-in target: The pattern suggests a possible change in direction but does not calculate how far price may rise.
- Weak signal in a flat market: Without a clear downtrend, the formation may be ordinary consolidation rather than a reversal.
- Confirmation can reduce the reward: Waiting for extra proof may mean entering at a higher price with a wider stop.
- Gap risk: Overnight news can cause price to open below the stop-loss, leading to a loss larger than planned.
- Liquidity risk: Wide bid–ask spreads can increase entry and exit costs in thinly traded shares.
- Behavioural risk: Fear of missing out may push a trader to enter before confirmation, while reluctance to accept a loss may lead to moving the stop lower.
- Indicator overload: Adding many indicators after the fact can produce conflicting signals and encourage selective interpretation.
Tips for Beginners
- Mark the downtrend before studying the two candles.
- Compare real bodies, not only candle colours.
- Write down the exact entry, stop-loss, and target rules before placing an order.
- Wait for the chosen confirmation; do not change the rule after seeing the next move.
- Prefer liquid shares or indices where entry and exit prices are easier to obtain.
- Keep the amount at risk small enough that one failed setup does not affect the trading plan.
- Check for results, regulatory announcements, or major events that can cause price gaps.
- Practise by marking old charts and recording outcomes before using real money.
- Review both successful and failed patterns to avoid confirmation bias.
Bullish Harami vs Bullish Engulfing
Both are two-candle patterns that can appear after a downtrend. Their body relationships are opposite.aliceblueonline+1
Point | Bullish Harami | Bullish Engulfing |
First candle | Large bearish body | Small bearish body |
Second candle | Small bullish body | Large bullish body |
Body relationship | Second body sits inside the first | Second body covers the first |
What it first suggests | Selling has slowed | Buyers have reversed the prior body |
Confirmation | Still preferred | Still preferred |
Stop-loss reference | Often below pattern low | Often below pattern low |
The Bullish Harami signals hesitation after selling. The Bullish Engulfing shows a stronger one-session takeover by buyers, but neither pattern guarantees that the rise will continue.
Common Mistakes to Avoid
- Ignoring the earlier trend: A Harami in a sideways range is not a proper bullish reversal setup. First, check whether price was falling.
- Using the entire high-to-low range as the containment test: The usual definition compares real bodies. Treat the wicks separately.
- Assuming the second candle proves a reversal: It only shows that selling has paused. Wait for the selected confirmation rule.
- Calling any small second candle a Bullish Harami: Check that both its open and close are inside Candle 1’s body.
- Entering because price briefly crosses a level: Decide whether the setup needs an intraday breakout or a closing breakout; the two are not the same.
- Skipping the stop-loss: A failed reversal can lead to another sharp fall.
- Using a fixed target without checking resistance: A nearby resistance zone may leave little upside compared with the amount at risk.
- Risking the same number of shares in every trade: Position size should reflect the distance between entry and stop-loss.
- Chasing the trade after a large gap-up: A late entry can worsen the reward-to-risk balance.
Who Should Use This Pattern?
The Bullish Harami is mainly useful to active market participants who already understand basic candles, trend direction, support, and stop-loss orders.
It may suit:
- Swing traders looking for a possible turn after a short-term decline.
- Positional traders studying daily or weekly charts.
- Intraday traders who apply the same rules to shorter candle periods and accept the added noise.
- Long-term investors who use it only to help time an entry after completing business and valuation research.
It may be less suitable for someone who wants guaranteed signals, cannot monitor risk, or buys solely because two candles match a shape.
Conclusion
The Bullish Harami pattern is a two-candle sign that selling pressure may be losing strength after a downtrend. A large red candle is followed by a smaller green body contained within it. The pattern is easy to recognise, but it does not confirm that the price will rise. Check the earlier trend, decide what confirmation means before entering, and place the stop-loss at a level that clearly invalidates the setup. Use support, volume, or a simple momentum tool only as supporting evidence, and size the position according to the loss you can accept.
Frequently Asked Questions
It is better treated as an alert than a direct buy signal. Many traders wait for price to break or close above the second candle’s high before considering an entry.
One common rule is to wait for the next candle to close above the small second candle’s high. A stricter trader may wait for a close above the first candle’s high; the rule should be selected before the trade.
A common reference is just below the lowest low of the two pattern candles. The stop should also fit the trader’s risk limit and account for the share’s usual price movement.
The classic form uses a small bullish, or green, second candle. Some charting definitions accept a small body of either colour, but a green body makes the bullish reading easier for beginners.
No. The main condition is that the second candle’s real body lies inside the first candle’s real body; the wicks can extend beyond it.
A Harami compares the two candles’ real bodies and requires bullish reversal context after a decline. An inside bar usually requires the entire second candle’s high-to-low range to remain inside the first candle’s high-to-low range.

Blog by Aliceblue News Desk


