
Dead Cat Bounce Meaning & Pattern: 2008 Nifty Crash Example Explained
Blog by Aliceblue News Desk
04 June 2026
13 minutes
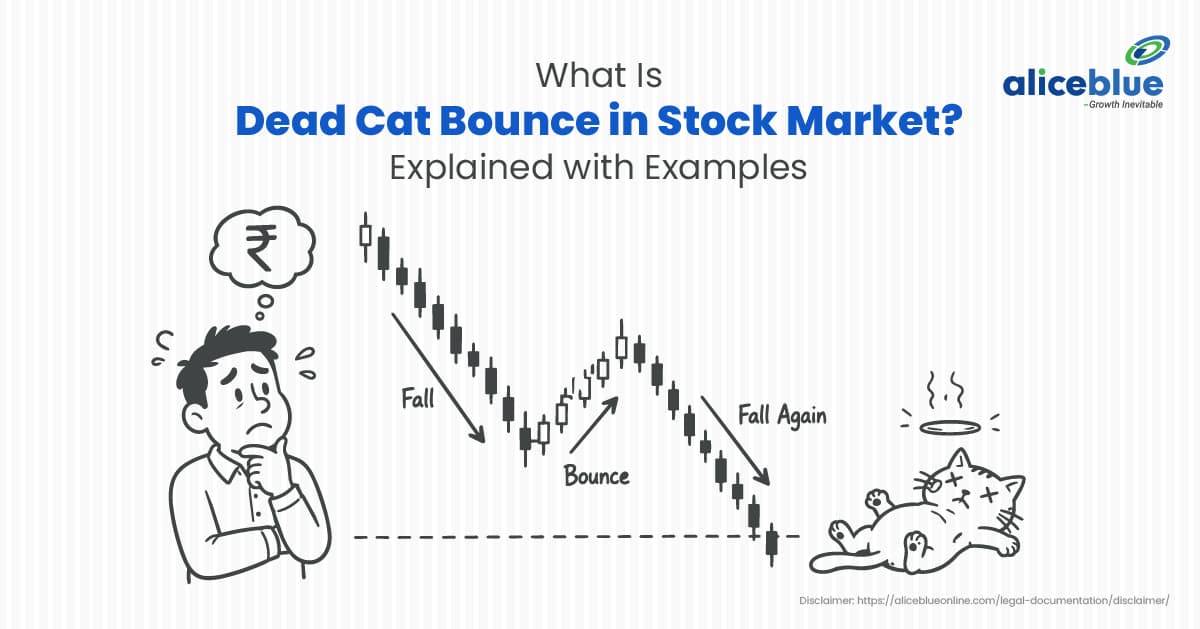
Imagine watching your favorite stock plummet for weeks, erasing your hard-earned gains. You feel a sinking sense of regret. Then, suddenly, green appears on your screen, and the stock surges 8% in one session. Relief washes over you; you believe the bottom is finally in and pour more cash into the position to “buy the dip.” But within days, the stock violently reverses, plunging 15% lower than before. You didn’t catch a market recovery; you walked straight into a trap.
Every trader eventually faces a scenario where a heavily declining stock suddenly experiences a sharp, unexpected upward rally. To an untrained eye, this sudden surge looks like a structural trend reversal and an ideal buying opportunity. However, experienced market participants know that these rapid spikes are often temporary illusions.
In this article, you will learn exactly how to identify a dead cat bounce stock market pattern, why these false rallies happen, and how to use technical indicators to protect your trading capital from heavy losses.
What Is a Dead Cat Bounce in the Stock Market?
A dead cat bounce in the stock market is a temporary, short-lived recovery in the price of a declining stock, followed closely by a continuation of the primary downtrend. It is a false rally, often called a bull trap, that creates a deceptive illusion of a market reversal when the underlying fundamentals remain weak.
Why Does a Dead Cat Bounce Happen?
The concept of a dead cat bounce is derived from an old Wall Street saying: “Even a dead cat will bounce if it falls from a great height.” Translated to the stock market, it means that even the weakest, fundamentally broken stocks will experience minor price increases during a severe sell-off. This happens due to mechanical market forces rather than actual operational improvements within the underlying company.
In the Indian share market, this phenomenon is frequently observed during bear markets or when a specific stock hits a major negative trigger, such as a severe earnings miss, regulatory actions by SEBI or the RBI, or a structural breakdown in its sector. The bounce occurs because stock prices never move down in a perfectly straight line; instead, they decline in jagged waves dictated by short-term shifts in supply and demand.
How a Dead Cat Bounce Works in the Share Market
A dead cat bounce progresses through a highly predictable sequence of market movements across the trading sessions:
- The Initial Freefall: A stock faces aggressive selling pressure, dropping rapidly on massive trading volume due to negative triggers or poor quarterly results.
- The Profit-Booking Pause: Short-sellers who made substantial profits during the drop begin covering their positions, creating a brief pause in the downward momentum.
- The False Recovery: Driven by short covering and emotional retail buying, the stock price begins to climb. This upward move typically occurs at a significantly lower delivery volume than the initial crash.
- The Resistance Failure: As the stock climbs, it encounters a major technical resistance level, such as the 50-day or 200-day Simple Moving Average (SMA), where fresh buying momentum completely dries up.
- Downtrend Resumption: Institutional investors and bears re-enter the market to sell or short the stock at the higher price, dragging the stock down past its previous support floor and trapping new buyers.
Dead Cat Bounce Example: Nifty 50 During the 2008 Market Crash
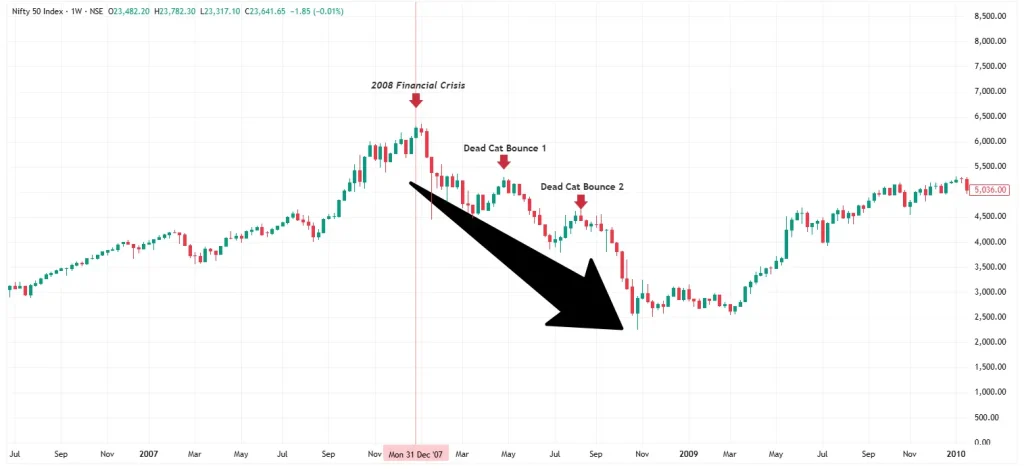
A historic, macro-level example of a dead cat bounce stock market event occurred on the benchmark Nifty 50 index during the infamous 2008 Global Financial Crisis.
When the US subprime mortgage meltdown began triggering global panic, the Indian market was hit by aggressive Foreign Institutional Investor (FII) outflows. The Nifty 50 index had hit a massive peak of 6,138.60 in December 2007 before entering a brutal bear market. By March 2008, the index had experienced a sharp, multi-month freefall, crashing by over 22% to sit at 4,734.50.
At this point, the market staged a highly deceptive recovery. Media narratives eagerly claimed that the Indian economy was “decoupled” from the West, which prompted institutional short-sellers to book profits and emotional retail investors to aggressively buy the dip. This wave of buying pushed the Nifty 50 all the way back up to 5,165.90 in April 2008, a major relief rally of over 9% that convinced thousands of traders that the worst was over.
However, the global systemic crisis was far from resolved. Once short-term short covering dried up, the underlying macro headwinds took back full control. Aggressive institutional dumping resumed, and by June 2008, the index completely smashed through its previous support floor, crashing down to 4,040.55 before eventually hitting a historic trough near the 2,500 mark in early 2009. The sharp April 2008 jump up to 5,165 was a textbook, market-wide dead cat bounce that trapped billions in retail capital.
How to Identify a Dead Cat Bounce on a Stock Chart
Spotting a dead cat bounce in real-time requires looking past the daily green candles and focusing on structural chart indicators. Here is how to identify the pattern on your charting platform:
1. The 38.2% Fibonacci Resistance Wall
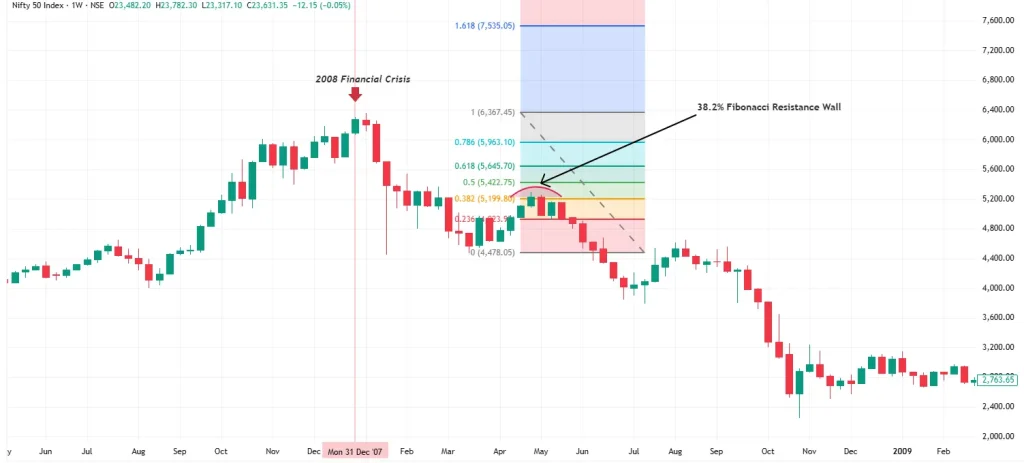
When a stock rebounds, plot the Fibonacci Retracement tool from the absolute peak of the initial crash to the local bottom. A classic dead cat bounce will stage a quick rally but will sharply stall, face heavy selling pressure, and fail to sustain a daily close above the 38.2% Fibonacci level. If it cannot clear this line, the rally is highly deceptive.
2. Extreme Divergence on the Volume Profile
This is your most reliable confirmation tool. Look closely at the volume bars at the bottom of your chart:
- During the crash: The volume bars should be massive and red, showing institutional dumping.
- During the bounce: The volume bars will be noticeably small and green. A rising price accompanied by falling or flat volume indicates that big money (FIIs and DIIs) is sitting out, and the rally is purely retail-driven.
3. The 20-day EMA Ceiling
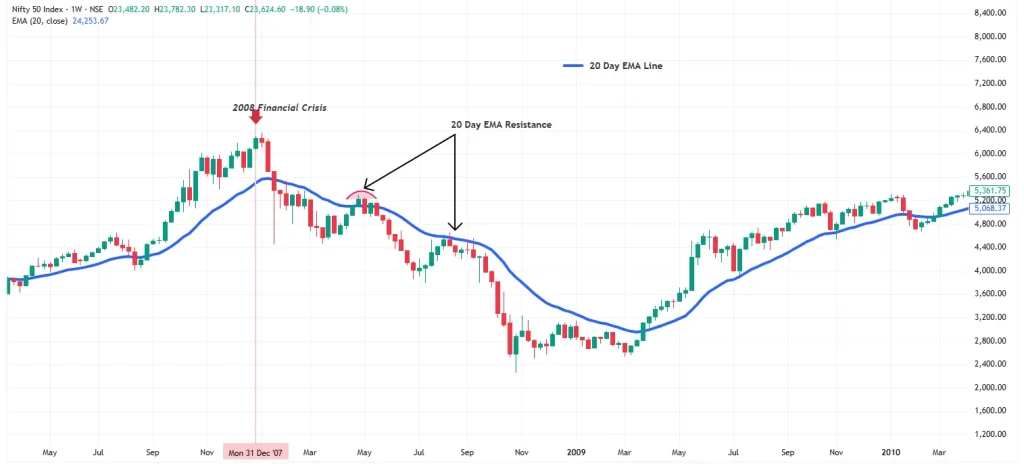
In a strong structural downtrend, the 20-day Exponential Moving Average (EMA) acts as a dynamic ceiling. During a false recovery, the stock price will often spike up toward the 20-day EMA line but fail to register consecutive daily closes above it. A sharp rejection wick at this moving average is a clear sign that bears are reloading their short positions.
4. Oversold RSI Relief
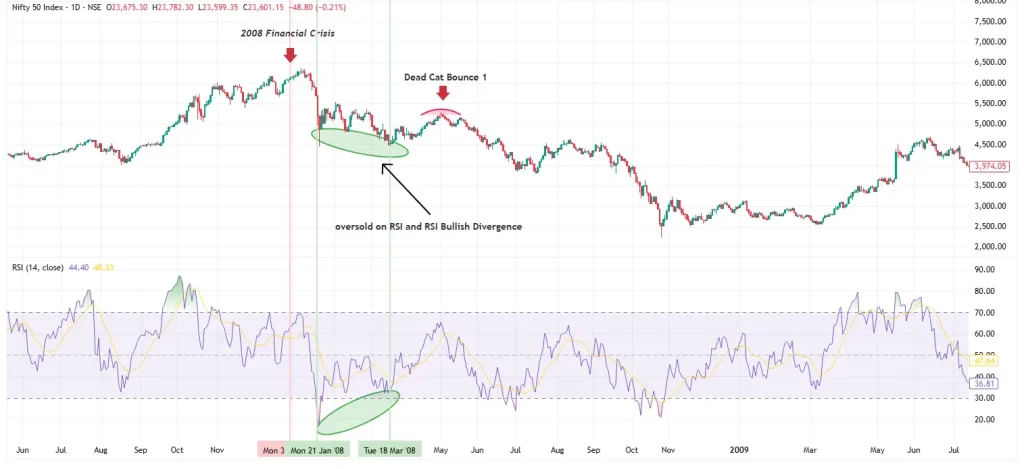
Check the Relative Strength Index (RSI) on the Daily (1D) timeframe. Before the bounce, the RSI will typically be heavily oversold (below 30 or even 20). The subsequent price rally is often just a mechanical relief of this extreme technical reading. The RSI will crawl back up toward the 45–50 zone, but without entering true bullish territory, before turning back downward.
To learn more about RSI Bullish Divergence, read “What Is the RSI (Relative Strength Index) and How Do You Use It? Complete Guide for 2026”.
Key Signs of a Dead Cat Bounce Pattern
You can easily identify this deceptive pattern by tracking these core characteristics:
- Prior Major Downtrend: The asset must be locked in a clear, multi-week or multi-month downward trajectory.
- Low Delivery Volume: While the price goes up during the bounce, the total delivery volume (shares actually taken home by long-term investors) remains remarkably low.
- Short-Lived Duration: The false rally is brief, typically lasting anywhere from three trading sessions to a maximum of two weeks.
- Lower High Formation: The peak of the bounce fails to cross previous swing highs or major moving average lines on the daily chart.
Why Traders Track Dead Cat Bounce Patterns
Developing a deep understanding of this market pattern provides structural advantages to your trading approach:
- Capital Protection: It prevents you from impulsively buying a crashing stock too early, saving you from devastating portfolio drawdowns.
- Short-Selling Setups: Intraday and derivative (Futures & Options) traders can use the top of a failed bounce as a high-probability entry point to initiate short positions.
- Smart Exit Windows: If you are trapped in a fundamentally weak stock, the bounce offers a short, optimal window to exit your delivery holdings at a slightly better price.
Risks of Trading a Dead Cat Bounce
While identifying this pattern is highly beneficial, traders must be aware of its specific limitations:
- Hindsight Identification: A dead cat bounce can only be confirmed with 100% accuracy after the price breaks below its previous low, making real-time execution highly challenging.
- High Intra-day Volatility: The bounce phase can feature sharp, erratic upper-circuit moves that can easily trigger your stop-loss before continuing downward.
- Risk of True Reversals: If a company suddenly releases a major positive announcement or secures institutional funding during the bounce, the pattern can transform into a genuine, long-term trend reversal, exposing short-sellers to losses.
Dead Cat Bounce Trading Tips for Beginners
If you are navigating a volatile market environment, implement these disciplined habits to safeguard your capital:
- Avoid the “Cheap Stock” Illusion: Never buy a stock simply because it has corrected by 50% or 60% from its all-time high. A cheap stock can always get cheaper.
- Wait for a Confirmed Higher Low: Do not buy the very first green rally. Wait for the stock to pull back a second time. If the second drop stops at a level higher than the previous bottom and turns back up, you have a structural confirmation of safety.
- Always Deploy a Hard Stop-Loss: If you take a high-risk trade to play a short-term recovery bounce, place an unconditional stop-loss order right below the recent swing low to automatically cut your losses if the bounce fails.
Dead Cat Bounce vs True Trend Reversal
To avoid costly mistakes, you must learn to distinguish a structural turnaround from a mechanical market reaction.
Feature | Dead Cat Bounce (False Rally) | True Trend Reversal (Bullish Turn) |
Trading & Delivery Volume | Decreases or stays flat as the price ticks upward. | Increases substantially, indicating Domestic Institutional Investor (DII) buying. |
Fundamental Trigger | Driven entirely by market noise, technical oversold conditions, or short covering. | Backed by concrete structural triggers (e.g., earnings turnaround, debt reduction). |
Pattern Duration | Highly brief; usually ranges between 3 and 14 days. | Sustained over several months, establishing a new bull run. |
Chart Structure | Forms a clear lower high and breaks to a lower low. | Successfully breaks through major resistance levels and forms higher lows. |
Common Dead Cat Bounce Trading Mistakes
Avoid these frequent traps that retail market participants fall into during major market corrections:
- Averaging Down Blindly: Injecting fresh capital into a structurally weak stock during a minor bounce, which only compounds your overall capital risk when the downtrend resumes.
- Ignoring Volume Data: Mistaking an intraday price surge for a true recovery without checking whether the move is backed by institutional buying volume.
- Failing to Track Sector Trends: Buying an individual stock’s bounce when its entire sectoral index (e.g., Nifty IT, Nifty Realty) is locked in a structural bear market.
How to Avoid Getting Trapped in a Dead Cat Bounce
Protecting your trading capital during a market correction comes down to strict execution discipline. Use these rules to ensure you do not buy into a false recovery:
1. Wait for a Confirmed "Higher Low" (The 2-Step Rule)
Never buy the very first green rally off a market bottom. Instead, practice patience:
- Step 1: Let the first bounce happen and peak out.
- Step 2: Wait for the inevitable secondary pullback. If the stock drops again but manages to find support at a price higher than its previous absolute bottom, it has formed a structural Higher Low. Only when the price breaks above the peak of the first bounce should you consider entering a long position.
2. Implement the "Delivery Volume" Filter
In India, check the delivery percentage data on the NSE or BSE website for the stock during its rally days. If a stock shoots up 5% in a session, but the delivery percentage is exceptionally low (below 25%-30%), it means the entire move was driven by intraday scalpers and speculators squaring off positions. Real, sustainable trend reversals require high delivery accumulation (typically above 50%).
3. Track Sectoral Index Strength
An individual stock rarely reverses its trend in isolation. If you see a banking stock staging a sudden recovery, look at the Nifty Bank or Nifty Private Bank index. If the broader sectoral index is still trading below its key moving averages and making lower lows, treat the individual stock’s rally as a dangerous trap.
4. Switch to a Capital Preservation Stop-Loss Strategy
If you decide to trade a high-momentum short-term bounce, you must accept that you are trading against the primary trend. Protect yourself by placing a hard, non-negotiable Stop-Loss order exactly 1% below the recent swing low. If the bounce turns out to be a fake-out, your trade will automatically close with a minor, controlled loss before the stock breaks into a deeper freefall.
Who Should Understand the Dead Cat Bounce Pattern?
- Intraday and Swing Traders: Short-term traders actively use this concept to identify optimal entry zones for short positions in the futures segment or when buying put options.
- Delivery-Based Long-Term Investors: Value-oriented investors use this concept defensively. It teaches them to stay patient and keep their cash deployed safely in liquid assets until a crashing stock completely clears its structural hurdles and finds a true fundamental floor.
Conclusion
A dead cat bounce stock market pattern serves as a critical warning that a green day on the charts does not automatically mean a trend reversal has begun. While a rapid upward move can trigger FOMO and create an emotional urge to buy the dip, doing so without looking at volume dynamics and underlying corporate health frequently leads straight into a value trap.
By focusing heavily on volume verification, waiting for structural confirmation via higher lows, and maintaining absolute stop-loss discipline, you can successfully avoid these traps and protect your capital for high-probability opportunities.
This article is for educational purposes only and should not be considered financial advice. Always conduct your own research before investing.
Frequently Asked Questions
Circuit filters make a false bounce highly dangerous in illiquid stocks. Operators pump the stock into consecutive Upper Circuits to trap buyers. When the bounce fails, the stock hits consecutive Lower Circuits, leaving you completely unable to sell or exit your position.
The Daily (1D) and Weekly (1W) charts are the most reliable. Intraday timeframes (like 5-minute or 15-minute charts) are ineffective because they mostly show minor, short-term market noise rather than a structural false rally.
It comes down to scale and duration. A dead cat bounce is short-lived (3 to 14 days) and typically isolates a single stock or sector. A bear market rally is a broader, market-wide move that can deceptively push major indices upward for several weeks or months.
Look at Fibonacci Retracement levels and the 20-day Exponential Moving Average (EMA). A dead cat bounce usually fails and reverses precisely between the 38.2% and 50% Fibonacci levels, while failing to close above the 20-day EMA.
Since you cannot short delivery shares overnight in India, the safest way is to use the options market. Instead of shorting futures, buy out-of-the-money (OTM) Put Options or deploy a Bear Call Spread to strictly cap your maximum risk.

Blog by Aliceblue News Desk


