
What Is the RSI (Relative Strength Index) and How Do You Use It? Complete Guide for 2026
Blog by Aliceblue News Desk
28 April 2026
9 minutes
It’s 9:45 AM on a Tuesday, you’re staring at your portfolio, Reliance stock has been climbing steadily for two weeks, and you’re up 18%, and then, in a single red candle, it drops 4% in 20 minutes, and you enter panic mode and sell everything at the bottom, and the very next day it bounces back up 7%, and your emotion cost you ₹47,000 in losses.
If this has happened to you, you aren’t alone; lakhs of retail traders lose money exactly like this every month, and the market doesn’t care about your feelings. But there is a useful tool that could have saved you from panic selling and given you an estimate of where exactly to book a profit or buy the dip.
In this complete 2026 guide, we’ll explain what RSI is, how it’s calculated, how to read it like an expert, and five strategies that work in Indian market conditions and exact mistakes 90% of traders still make today.
What Is the Relative Strength Index (RSI)?
The Relative Strength Index, or RSI, is a momentum oscillator that measures the speed and change of price movements on a scale of 0 to 100.
It was created by J. Welles Wilder Jr. in 1978 and first appeared in his book New Concepts in Technical Trading Systems.
Important Note: RSI does not compare a stock’s strength against other stocks or the broader market; it just compares the stock’s own recent gains versus its recent losses, which is why it’s called “Relative Strength”.
How Is RSI Calculated?
Default setting: 14 periods (the one Wilder recommended and almost everyone uses in India).
Formula:
- RSI = 100 – [100 / (1 + RS)]
Where:
RS (Relative Strength) = Average Gain / Average Loss over the chosen 14 periods.
Step-by-step:
- Calculate the average gain over the last 14 periods (only positive price changes).
- Calculate the average loss over the last 14 periods (only negative price changes, taken as positive numbers).
- Divide average gain by average loss → that gives you RS.
- Plug into the RSI formula above.
On the very first calculation, it uses simple averages. After that, it switches to Wilder’s smoothing method (which all charting software uses).
Tip: On intraday charts, many Indian traders switch to 9-period or 7-period RSI for faster signals. Daily charts almost always stick to 14.
How to Read RSI Values - Overbought, Oversold & Momentum Shifts
RSI Level | Market Condition | Typical Action in India |
Above 70 | Overbought | Potential sell or booking profits |
50-70 | Bullish momentum | Stay long or look for dips to buy |
40-50 | Neutral / Weakening | Caution: watch for reversal |
Below 30 | Oversold | Potential buy or covering shorts |
Nifty 50 Example:
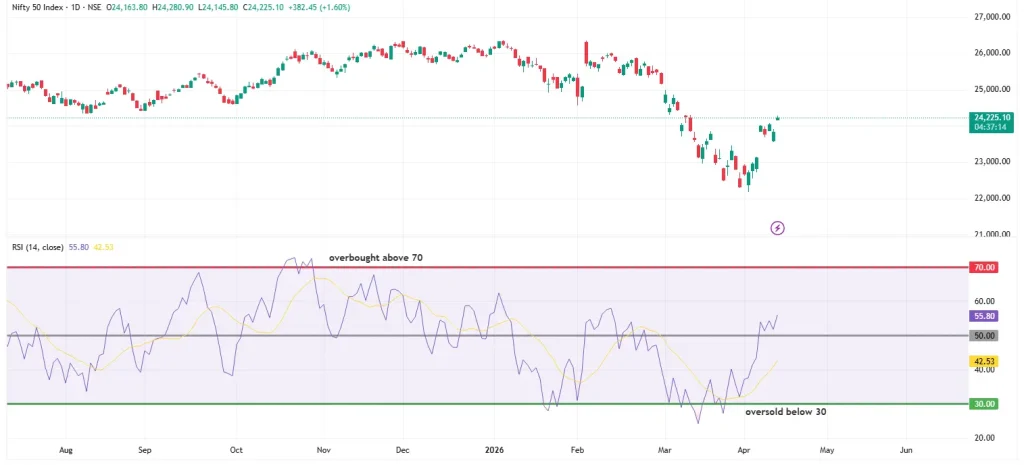
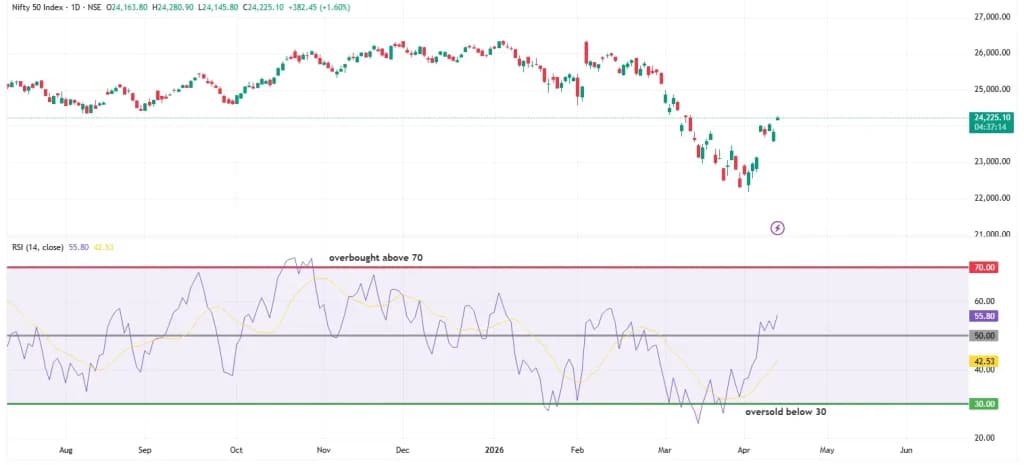
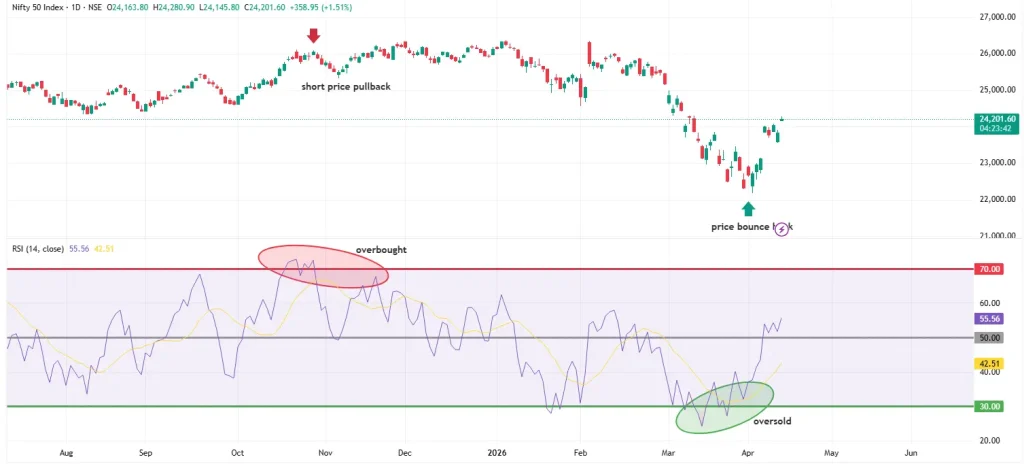
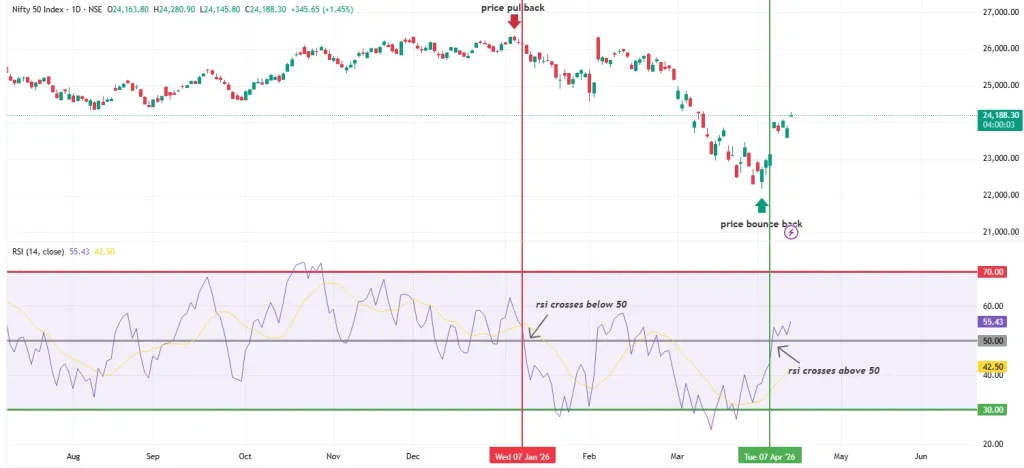
Picture above: Shows the current Nifty 50 chart, where we see the price went below the oversold region in March-April of 2026 and bounced back as a direct result. The price was overbought around late October of 2025, followed by a pullback as a direct result.
Key nuances for Indian markets:
- In strong bull markets (like the 2023-2025 Nifty rally), RSI can stay above 70 for weeks without crashing. Never sell just because it’s “overbought” in a strong trend.
- In bear markets, RSI can stay below 30 for long stretches.
- The 50-line is extremely powerful: crossing above 50 often signals the start of a fresh uptrend.
Proven RSI Trading Strategies for Indian Markets
Strategy 1: Classic Overbought / Oversold (Best for Beginners)
- Buy when RSI crosses above 30 from below (oversold bounce).
- Sell when RSI crosses below 70 from above (overbought exhaustion).
- Best used in range-bound markets or after sharp corrections.
- Example:
Strategy 2: RSI Divergence (The Highest Probability Setup)
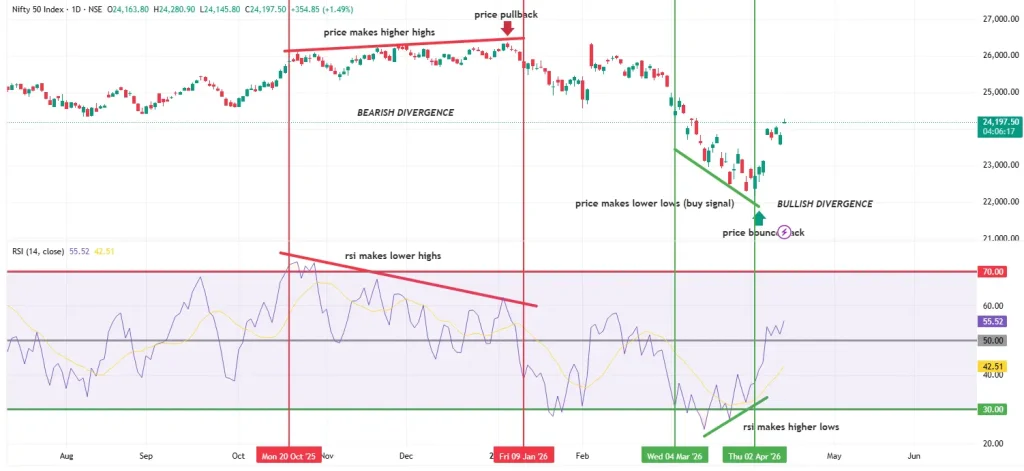
This is the single most powerful RSI signal in Indian markets.
- Bullish Divergence: Price makes a lower low, but RSI makes a higher low → strong buy signal.
- Bearish Divergence: Price makes a higher high, but RSI makes a lower high → strong sell signal.
- Example:
Divergence works especially well on Bank Nifty and mid-cap stocks during earnings season.
Strategy 3: RSI 50-Line Crossover
- RSI crosses above 50 → bullish momentum shift → buy.
- RSI crosses below 50 → bearish momentum shift → sell or exit.
- Example:
Combine with a 200-day EMA for trend confirmation.
Strategy 4: Failure Swings (Advanced)
- Bullish Failure Swing: RSI falls below 30, rises, pulls back but stays above 30, then breaks previous high → aggressive buy.
- Works brilliantly in volatile stocks.
Strategy 5: Confluence with Other Indicators (What Pros Actually Do)
Best Indian setup in 2026:
RSI (14) + 50 & 200 EMA + Volume + Support/Resistance.
Example: When RSI crosses above 50, price is above 50 EMA, and volume is rising → high probability for upside movement.
Additional Resources:
- Learn about the basics of support/resistance with chart examples from our blog.
- 50 & 200 EMA from this blog that covers all the best indicators for swing trading using chart examples.
How to Use RSI in Intraday vs Positional Trading in India
Intraday (5-min or 15-min charts):
- Use a 9-period or 7-period RSI for faster signals.
- Look for oversold bounces near important support levels (VWAP, previous day low).
- Never take the RSI signal alone; always confirm with the candlestick pattern and volume.
- Best during 9:15-10:30 AM and 1:30-3:00 PM windows.
Positional / Swing (Daily Charts):
- Stick to the standard 14-period RSI.
- Combine with weekly charts for the bigger picture.
- Perfect for holding 3-15 days, exactly how most retail traders in India prefer to trade.
Tip: Banking and auto stocks respect RSI levels more than IT stocks (which can stay overbought longer).
Best Platforms & Tools to Use RSI in India (2026)
TradingView is the best in class for both advanced and custom traders, providing free and paid plans, but if you were to sign up on AliceBlue, you’d get access to all premium features on TradingView because of the tie-up.
How to add RSI on TradingView:
- Indicators → search “RSI” → add → change to 14 period.
Common Mistakes Indian Traders Make with RSI (And How to Fix Them)
- Treating 70 and 30 as magic numbers → Fix: Use them as zones, not exact lines.
- Using RSI alone in strong trending markets → Fix: Always check the bigger trend first.
- Ignoring volume and news → Fix: Never trade RSI during high-impact events (RBI policy, budget, or US Fed).
- Over-trading every signal → Fix: Wait for confluence (2-3 reasons to enter).
- Using default settings blindly on every timeframe → Fix: Adjust period based on your style.
Limitations of RSI
- Lags in very strong trends (can stay overbought for months).
- Gives false signals in sideways/choppy markets (very common in India during low-volume periods).
- Works best when combined with price action and volume.
Conclusion
RSI is still one of the most powerful tools available to Indian traders in 2026, which will help you avoid making those emotional ₹40,000 mistakes.
To implement these RSI strategies effectively, many traders use professional charting platforms to monitor real-time data. Through a partnership with Alice Blue, traders can access TradingView’s full suite of technical tools, including customised RSI settings, multi-timeframe analysis, and divergence alerts, directly within their trading interface.
For those looking to streamline their workflow, opening a Demat account with a discount broker like Alice Blue allows you to monitor advanced TradingView RSI charts and execute trades from a single, integrated platform.
Frequently Asked Questions
- Yes, RSI divergence and 50-line crossovers on 5-min. or 15-min. Charts are very popular among Bank Nifty and Nifty options traders, and they work well for 1-3 day expiry trades because options are highly sensitive to momentum shifts. Just remember to combine RSI with volume and support/resistance, as explained in Strategy 5.
RSI is primarily a short-to-medium-term momentum tool, but can be used on weekly or monthly charts to spot major trend reversals for positional or long-term investors. For pure buy-and-hold investing, combine it with fundamental analysis rather than relying on it alone.
- During these events, the market moves very fast, and RSI often gives false signals because of sudden spikes in volatility. The safest approach is to avoid taking fresh RSI-based trades on the day of the event and wait for the market to stabilise before using the strategies mentioned.
Both are momentum oscillators, but RSI measures the strength of recent gains versus losses over 14 periods, while Stochastic compares the closing price to the recent
RSI works on any price-based chart, Nifty 50, Bank Nifty, sectoral indices, ETFs, commodity futures on MCX, or even mutual fund NAV charts, and the same rules and strategies apply to them.

Blog by Aliceblue News Desk


