Differences Between Hammer and Inverted Hammer
Blog by Aliceblue News Desk
16 February 2025
7 minutes
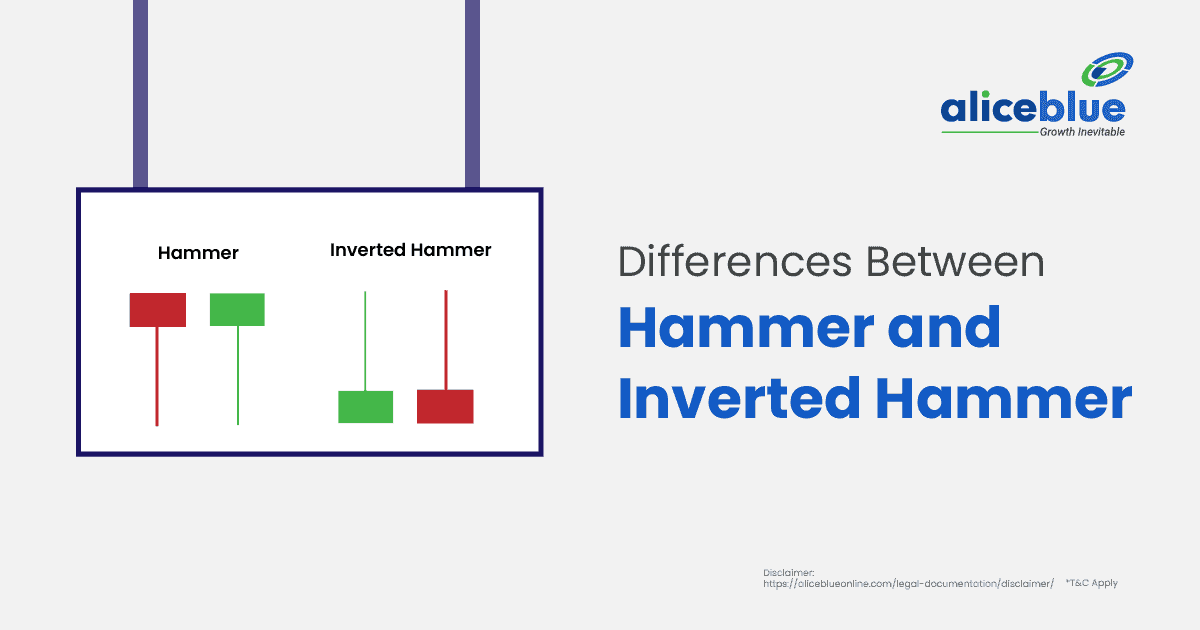
The Hammer and Inverted Hammer are single-candlestick patterns that commonly appear after a downtrend. Both can indicate a possible bullish reversal, but their wick formation and price behaviour are different.
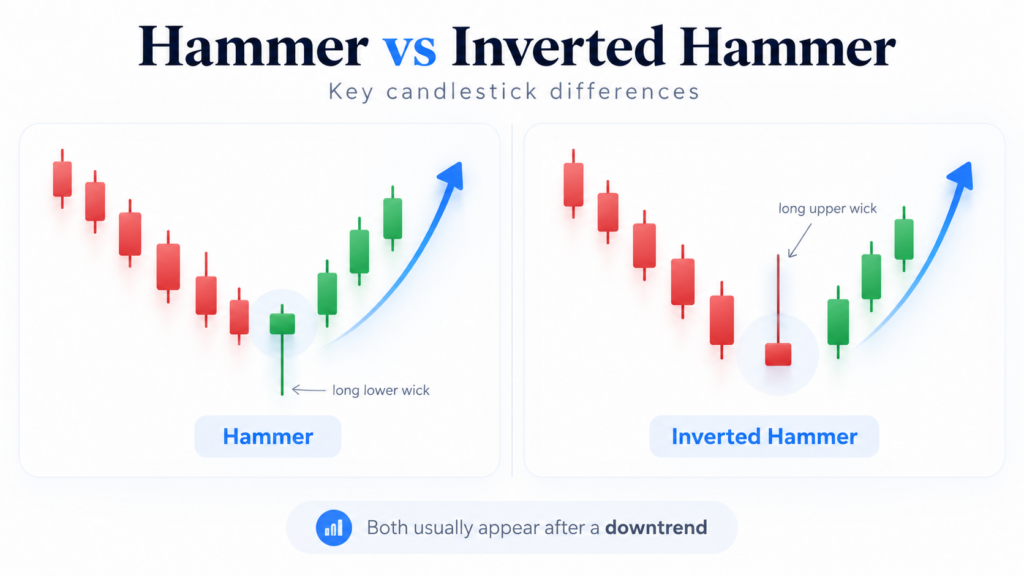
Quick Definition
A Hammer has a small real body near the top of the candle and a long lower wick. It appears after a decline and shows that price moved lower during the session but recovered before the close.
An Inverted Hammer has a small real body near the bottom and a long upper wick. It also appears after a decline and shows that buyers pushed the price higher during the session, although the price moved back towards the open by the close.
Both patterns need confirmation from subsequent price action and should not be treated as standalone buy signals.

What Is a Hammer Pattern?
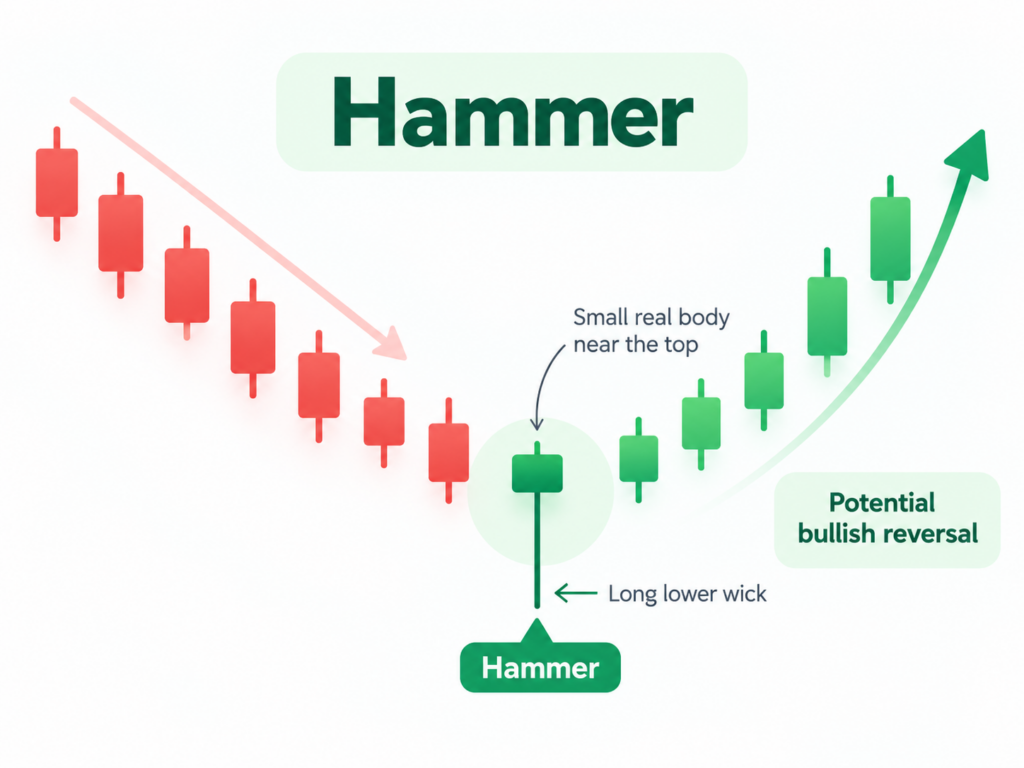
A Hammer is a single-candlestick pattern that generally appears after a downtrend.
It has:
- A small real body near the upper part of the candle
- A long lower wick
- Little or no upper wick
The lower wick shows that sellers pushed the price lower during the session, but the price recovered and closed closer to the opening level.
This rejection of lower prices can indicate that selling pressure may be weakening. However, a Hammer does not guarantee a bullish reversal.
Traders often look at the following candle, volume, support levels, and the broader price trend before interpreting the pattern.
What Is an Inverted Hammer Pattern?
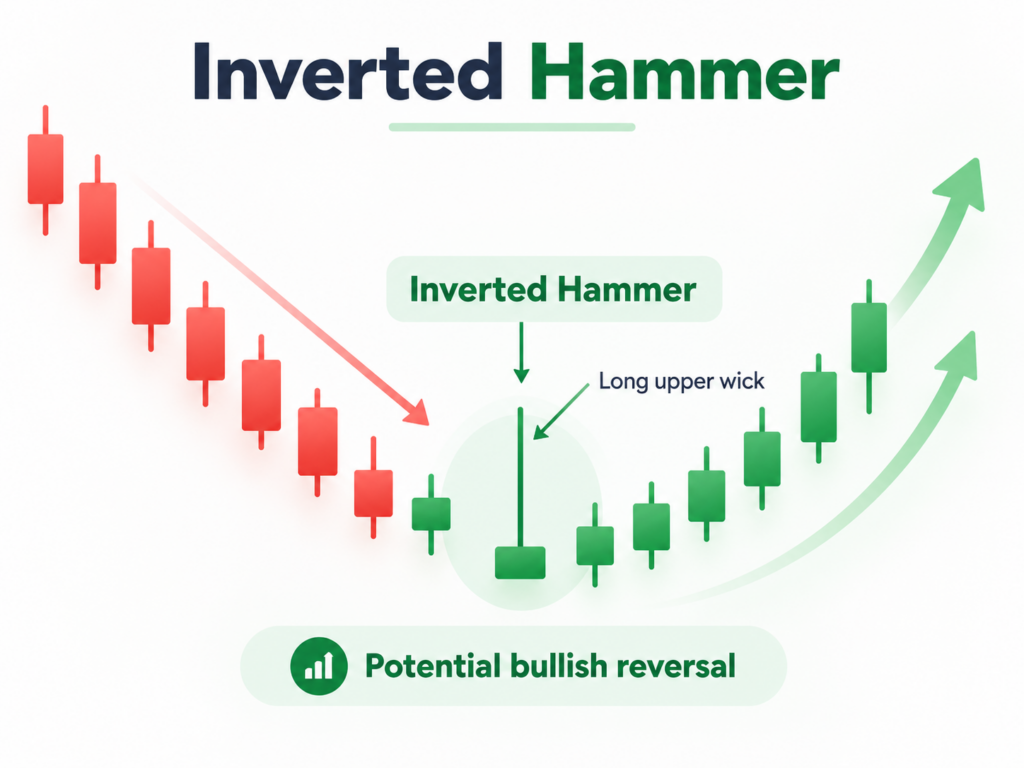
An Inverted Hammer is another single-candlestick pattern that can appear after a downtrend.
It has:
- A small real body near the lower part of the candle
- A long upper wick
- Little or no lower wick
During the session, buyers pushed the price higher, but the price moved back towards the opening level before the close.
This shows that buyers were able to push prices higher, although selling pressure remained present. When the pattern appears after a decline, it can indicate a possible change in momentum.
Confirmation from subsequent price action is generally used before treating the pattern as a potential bullish reversal.
Differences Between Hammer and Inverted Hammer
The main difference between the two patterns is the direction of their long wick.
| Aspect | Hammer | Inverted Hammer |
| Typical location | After a downtrend | After a downtrend |
| Real body | Small body near the top | Small body near the bottom |
| Long wick | Lower wick | Upper wick |
| Price behaviour | Price falls and then recovers | Price rises and then moves back towards the open |
| Common interpretation | Possible bullish reversal | Possible bullish reversal |
| Confirmation | Subsequent price action is generally used | Subsequent bullish price action is generally used |
Simple Difference
Hammer: Long wick below the body.
Inverted Hammer: Long wick above the body.
The market context is also important. The same candle shape does not carry the same interpretation when it appears in the middle of a range or during a different trend.
How Does a Hammer Candlestick Pattern Work?
A Hammer forms when the price moves significantly lower during a trading session but recovers before the session ends.
For example:
- The stock opens at ₹100.
- Selling pressure pushes the price down to ₹90.
- Buyers enter and push the price back towards ₹99.
- The candle closes near its opening level.
The result is a small body with a long lower wick.
The long lower wick shows that lower prices were rejected during that session. When the pattern appears after a decline, this can be a sign that the balance between buyers and sellers may be changing.
However, the candle itself does not confirm a reversal. Traders may look at the next candle and other technical factors for confirmation.
Importance of Hammer Pattern
The Hammer can be useful when studying possible changes in price momentum after a decline.
- Shows Rejection of Lower Prices: The long lower wick shows that the price moved lower but recovered before the close.
- Can Appear Near Support: A Hammer forming near an established support level may attract attention because the price has shown rejection of lower levels.
- Can Be Used With Volume: Higher trading volume around the pattern can provide additional information about participation, although volume alone does not confirm a reversal.
- Helps Study Price Action: The Hammer provides information about the relationship between the opening, closing, high, and low prices within a single candle.
How Does an Inverted Hammer Candlestick Pattern Work?
An Inverted Hammer forms when buyers push the price higher during a session, but the price moves back towards the opening level before the close.
For example:
- A stock opens at ₹100.
- Buyers push the price to ₹112.
- Sellers enter and push the price back towards ₹101.
- The candle closes close to its opening level.
This creates a small body near the bottom and a long upper wick.
When this pattern appears after a downtrend, the upward price movement during the session can indicate that buyers are beginning to participate.
However, because sellers were able to push the price back down before the close, confirmation from subsequent price action is important.
Importance of Inverted Hammer Pattern
The Inverted Hammer can help traders study possible changes in momentum following a decline.
Can Be Combined With Other Tools: Traders may consider volume, support and resistance, moving averages and other technical indicators alongside the pattern.
Shows an Attempt to Move Higher: The long upper wick shows that buyers were able to push prices higher during the session.
Can Appear Near Support: An Inverted Hammer near a support level can provide additional context when analysing whether selling pressure may be weakening.
Requires Confirmation: A bullish candle following the Inverted Hammer can provide additional confirmation that buyers are gaining control.
Hammer vs Inverted Hammer: Trading Considerations
Neither pattern should be used in isolation.
Before acting on a Hammer or Inverted Hammer, traders may consider:
- Trend: Is the pattern actually appearing after a decline?
- Support: Is the candle forming near an important support area?
- Volume: Is there notable trading activity around the pattern?
- Confirmation: Does subsequent price action support the pattern?
- Risk management: Where would the trade setup become invalid?
For example, a Hammer appearing after a prolonged decline and near a support level may provide a different setup from an identical candle appearing randomly in the middle of a sideways market.
Hammer and Inverted Hammer Patterns – Quick Summary
- A Hammer is a single-candlestick pattern with a small body near the top and a long lower wick.
- An Inverted Hammer has a small body near the bottom and a long upper wick.
- Both commonly appear after a downtrend.
- Both can indicate a possible change in bullish and bearish momentum.
- A Hammer shows rejection of lower prices during the session.
- An Inverted Hammer shows that buyers pushed prices higher but could not hold those gains into the close.
- Neither pattern guarantees a trend reversal.
- Subsequent price action can provide additional confirmation.
- Support, resistance, volume and other technical indicators can be used alongside these patterns.
- Risk management remains important when using candlestick patterns for trading decisions.

Hammer vs Inverted Hammer – FAQs
1. What is the difference between a Hammer and an Inverted Hammer?
A Hammer has a long lower wick and a small body near the top of the candle. An Inverted Hammer has a long upper wick and a small body near the bottom. Both can appear after a downtrend and indicate a possible bullish reversal.
2. What does a Hammer candlestick pattern indicate?
A Hammer can indicate rejection of lower prices after a decline. When it appears after a downtrend, it may signal a possible change in momentum, but confirmation from subsequent price action is generally used.
3. How do you identify a Hammer pattern on a chart?
Look for a small real body near the upper part of the candle and a long lower wick. The pattern is generally considered a Hammer when it appears after a decline.
4. When does an Inverted Hammer typically appear?
An Inverted Hammer typically appears after a downtrend. It has a small body near the lower part of the candle and a long upper wick.
5. Is an Inverted Hammer bullish?
An Inverted Hammer can be a potential bullish reversal pattern when it appears after a downtrend. However, the pattern requires confirmation from subsequent price action and does not guarantee that the price will move higher.

Blog by Aliceblue News Desk
The Alice Blue Team is a passionate group of analysts delivering expert market insights, comprehensive coverage of stocks, economy, commodities, and personal finance through clear, actionable research.