Debt-to-Equity Ratio – DE Ratio
Blog by Aliceblue News Desk
05 December 2023
9 minutes
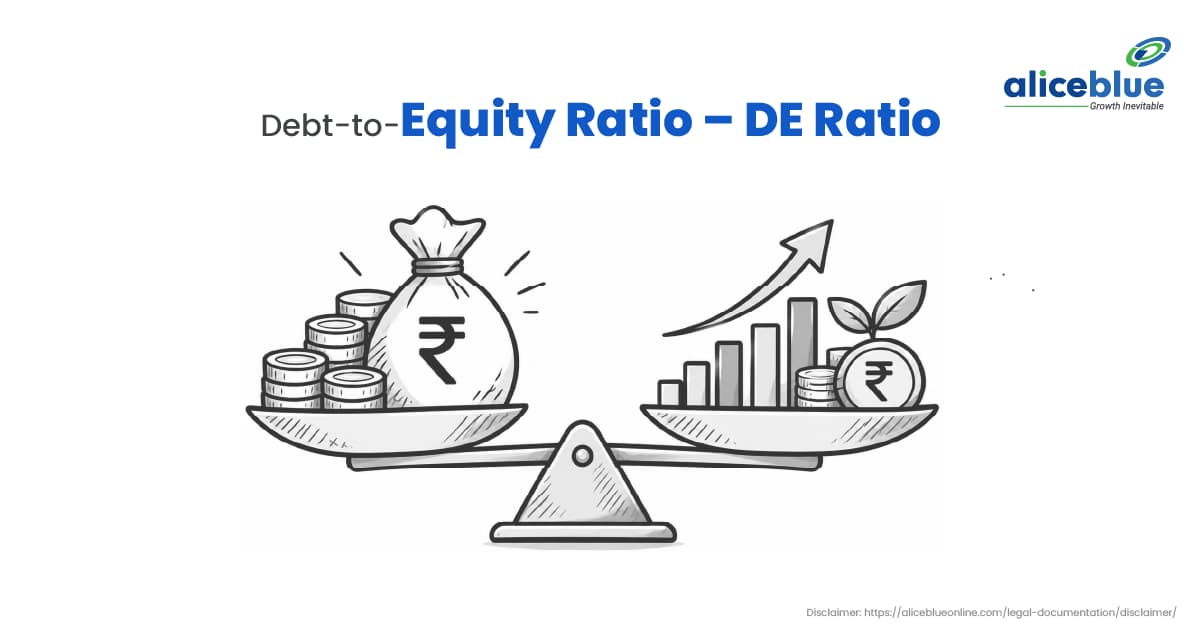
Quick Definition: Debt-to-Equity Ratio
The Debt-to-Equity ratio measures a company’s total liabilities relative to its shareholders’ equity. It shows how much of the business is funded by creditors versus owners, and by extension, how vulnerable the company is to interest rate changes, credit market conditions, and economic slowdowns.
Debt vs Equity Financing: How Companies Fund Their Business
Every Indian company deciding how to expand, build inventory, or acquire a competitor faces the same fundamental choice.
- Debt financing: borrowing from commercial banks, financial institutions, or issuing corporate bonds and debentures. Capital arrives quickly, and shareholders don’t get diluted. But repayments are mandatory regardless of business performance, and interest compounds regardless of whether the investment pays off.
- Equity financing: issuing shares to promoters and public investors, or reinvesting accumulated profits (retained earnings). No mandatory repayment. No interest burden. But dilution reduces existing shareholders’ ownership, and retained earnings that could have been invested elsewhere carry opportunity cost.
The D/E ratio shows which of these two paths dominates a company’s capital structure. A low ratio means owners are funding most operations. A high ratio means creditors hold significant financial leverage over the business, leverage that becomes dangerous when conditions deteriorate.
Debt-to-Equity Ratio Formula and Calculation
Debt to Equity Ratio = Total Liabilities / Total Shareholder’s Equity
Both inputs come from the balance sheet in the company’s annual or quarterly report under Indian Accounting Standards.
Total Liabilities include everything the company owes to external parties:
- Short-term (current) liabilities: trade payables, short-term bank loans, operating obligations due within 12 months
- Long-term (non-current) liabilities: bank term loans, corporate debentures, lease liabilities, deferred tax liabilities due after 12 months
Total Shareholders’ Equity includes:
- Equity Share Capital:l money raised directly from shareholders
- Reserves and Surplus: accumulated profits retained inside the business rather than paid as dividends
How to Calculate the Debt-to-Equity Ratio: Example
Astra Engineering Ltd., a manufacturing company listed on the NSE, reports:
- Short-term borrowings and payables: ₹200 crore
- Long-term bank loans and debentures: ₹400 crore
- Total Liabilities: ₹600 crore
- Equity share capital: ₹100 crore
- Reserves and surplus: ₹300 crore
- Total Shareholders’ Equity: ₹400 crore
D/E Ratio = ₹600 Crore / ₹400 Crore = 1.50
Astra Engineering carries 150% debt relative to its equity. For every ₹1 of shareholder capital, the company owes ₹1.50 to creditors and suppliers. Whether that’s acceptable depends entirely on the sector; in capital-intensive manufacturing, 1.5x might be manageable. In an asset-light software business, it would be alarming.
If you’re unfamiliar with balance sheets, understanding how assets, liabilities, and shareholders’ equity are reported can make it easier to calculate and interpret the D/E ratio.
What Does the Debt-to-Equity Ratio Tell Investors?
- Solvency indicator: tells you whether the business can survive a severe downturn without defaulting on loans. A company with a 3.0x D/E ratio during normal conditions has very little room for error if revenues decline 20%.
- Leverage measure: shows how aggressively management is using borrowed money to amplify business growth. High leverage can supercharge returns in good times and destroy equity in bad ones.
- Capital structure view: provides a clear picture of whose money is actually running the business, the owners’ or the creditors’.
- Sector dependence: benchmarks shift dramatically across industries. This is the single most important context note when applying the ratio.
The debt-to-equity ratio is one part of fundamental analysis, which also considers a company’s earnings, valuation, cash flow, and financial health before making an investment decision.
Debt-to-Equity Ratio vs Debt-to-Assets Ratio
| Feature | Debt to Equity Ratio | Debt to Assets Ratio |
| Formula | Total Liabilities ÷ Total Equity | Total Liabilities ÷ Total Assets |
| Comparison Base | Debt relative to shareholders’ ownership | Debt relative to total company assets |
| Value Range | 0 to infinity; can be negative if equity is negative | Always 0.0 to 1.0 |
| Primary Focus | Equity risk and capital structure balance | Asset coverage and liquidation security |
| Best Used For | Fundamental stock analysis for equity investors | Credit risk analysis by banks and rating agencies |
Advantages of the Debt-to-Equity Ratio
- Identifying default risk early is the most direct practical benefit. A D/E ratio rising consistently quarter over quarter, even while profits look healthy, often precedes financial distress by 12 to 18 months. Catching this trend before the market does gives investors time to exit before the collapse.
- Facilitating peer comparison makes the D/E ratio particularly useful when evaluating competing companies in the same sector. Two auto component manufacturers with similar revenue but very different D/E ratios have fundamentally different risk profiles; the higher-leverage one is more vulnerable to an interest rate cycle or demand slowdown.
- Filtering safe wealth creators over long time horizons requires the D/E ratio as a primary screen. The companies that compound steadily over decades tend to have manageable debt, because sustained high debt limits financial flexibility and creates fragility in every economic cycle.
Limitations of the Debt-to-Equity Ratio
- Sector bias is the most important caveat. Capital-intensive industries- power, infrastructure, real estate, and utilities require large bank loans to build long-term physical assets. D/E ratios of 1.5 to 3.0 are structurally normal in these sectors and don’t indicate distress. Comparing an infrastructure company’s 2.5x D/E with an IT company’s 0.1x D/E and concluding the infrastructure company is dangerously leveraged reflects a fundamental misunderstanding of capital-intensive business models.
- Financial institutions are entirely unsuitable for D/E analysis. Banks and NBFCs accept customer deposits and issue debt as their primary operational inventory; those liabilities fund the loans that generate revenue. A bank naturally operates with D/E ratios of 4.0 to 8.0x or higher. This isn’t leverage risk in the conventional sense; it’s the business model. Applying standard D/E analysis to banks produces meaningless conclusions.
- Gross debt ignores cash reserves, a common and costly analytical error. A company with ₹1,000 crore in total debt and a D/E ratio of 2.0 might hold ₹1,500 crore in liquid bank deposits. Net debt is actually negative; the company could pay off all its borrowings and still have cash left over. Net debt equals total debt minus cash and equivalents; this figure tells a much more accurate story than gross D/E alone.
- Off-balance-sheet liabilities can obscure true leverage. Corporate guarantees for subsidiary borrowings, pending tax litigation, and operating lease commitments that predate accounting standard changes may not be fully visible in the headline D/E figure. Reading the notes to financial statements is necessary for any meaningful analysis.
How to Analyse the Debt-to-Equity Ratio in Indian Stocks
- For standard manufacturing, FMCG, healthcare, and technology companies, target D/E ratios below 1.0 as a starting threshold. Below 0.5 reflects a genuinely conservative capital structure with significant financial flexibility.
- Pair the D/E ratio with the Interest Coverage Ratio before drawing any conclusions. A company might carry significant debt but cover interest payments with ease if operating profit is strong. The formula: EBIT divided by interest expense. A ratio above 3.0 to 4.0 indicates the company generates adequate operating profit to service its debt comfortably.
- Analyse the trend over multiple years rather than the single current figure. A D/E of 1.2x that has declined from 2.0x over three years tells a very different story from a D/E of 1.2x that has risen from 0.6x. Management actively reducing leverage is a positive signal. Rising leverage without proportional revenue growth is a warning.
- Use stock screeners to filter quickly. Screener.in, Trendlyne, and most broker research portals allow custom D/E ratio filters. Setting a maximum D/E of 1.0 for non-financial companies immediately narrows the investment universe to businesses with more conservative balance sheets a valuable first pass before deeper analysis.
Common Mistakes When Using the D/E Ratio
- Comparing across unrelated sectors is the most common misapplication of this ratio. A software exporter like TCS and a power generator like NTPC operate in fundamentally different capital environments. Concluding that NTPC is dangerously leveraged because its D/E exceeds TCS’s by a factor of 10 reflects a misunderstanding of what drives leverage in each business.
- Ignoring off-balance-sheet liabilities means the D/E you calculate from the headline balance sheet may significantly understate true financial obligations. Corporate guarantees, contingent liabilities, and pending litigation can create real financial exposure that the standard D/E formula doesn’t capture. The financial notes in the annual report are not optional reading for any serious fundamental analysis.
- Confusing gross debt with net debt makes healthy companies look riskier than they are. A company holding substantial cash reserves against its debt obligations is in an entirely different position from one with the same gross D/E ratio and minimal liquidity. Always calculate and check net debt alongside the standard D/E figure.
To get a more complete picture of a company’s financial health, compare the D/E ratio with other financial ratios used in stock analysis, rather than relying on a single metric.
Who Should Use the Debt-to-Equity Ratio?
- Long-term value investors building equity portfolios for multi-year compounding periods need the D/E ratio as a primary solvency screen. High-debt companies are structurally more fragile through economic cycles, which is precisely the multi-cycle period long-term investors are exposed to.
- Fundamental stock analysts reviewing corporate balance sheets for investment research use the D/E ratio as a standard component of solvency assessment alongside interest coverage, current ratio, and cash flow analysis.
- Credit rating agencies and commercial banks evaluating new loan applications or corporate bond ratings use the debt-to-assets ratio more frequently than D/E, but both metrics inform the same underlying question about a company’s capacity to service and repay obligations.
Conclusion
The Debt to Equity ratio is one of the simplest and most revealing balance sheet metrics available to Indian investors. It cuts through revenue and profit headlines to answer the question that determines survival during economic downturns: how much of this business is owned by shareholders versus owed to creditors?
Used correctly, within sector context, paired with interest coverage, calculated on a net debt basis, and tracked over multiple years, the D/E ratio helps retail investors avoid the debt-trap companies that look profitable during favourable conditions and collapse when those conditions change. That combination of contextual awareness and multi-metric analysis is what separates the D/E ratio as a useful screening tool from the D/E ratio as a potential source of misleading conclusions.
Frequently Asked Questions
1. What is a good D/E ratio for Indian stocks?
Below 1.0 is generally healthy for standard non-financial companies. Below 0.5 reflects a very conservative capital structure. Above 2.0 signals meaningful financial risk in most non-capital-intensive sectors, though infrastructure and power companies can sustain higher ratios given their long-term asset-backed revenue models.
2. Is zero debt always better?
Not necessarily. While zero debt eliminates bankruptcy risk, strategic borrowing at interest rates below the business’s return on capital can accelerate profitable expansion faster than waiting to accumulate internal earnings. The quality of what debt is funding matters as much as the quantity.
3. Why do Indian banks and NBFCs have such high D/E ratios?
Banks and NBFCs accept customer deposits and issue bonds to fund loan distributions; those deposits and borrowings are their liabilities, and extending loans from them is their core revenue-generating activity. D/E ratios of 4.0 to 8.0x or higher are structurally normal for financial institutions and should be evaluated using bank-specific metrics like Net Interest Margin, Capital Adequacy Ratio, and GNPA, not standard D/E analysis.
4. How do I check the D/E ratio for NSE or BSE listed companies?
Annual and quarterly balance sheets are published on official NSE and BSE portals. Financial screening platforms like Screener.in and Trendlyne aggregate this data with multi-year trend views and peer comparison tables. Most broker research portals also provide key ratios, including D/, E in their fundamental data sections.

Blog by Aliceblue News Desk
The Alice Blue Team is a passionate group of analysts delivering expert market insights, comprehensive coverage of stocks, economy, commodities, and personal finance through clear, actionable research.