Marubozu Candlestick Pattern
Blog by Aliceblue News Desk
21 February 2025
9 minutes
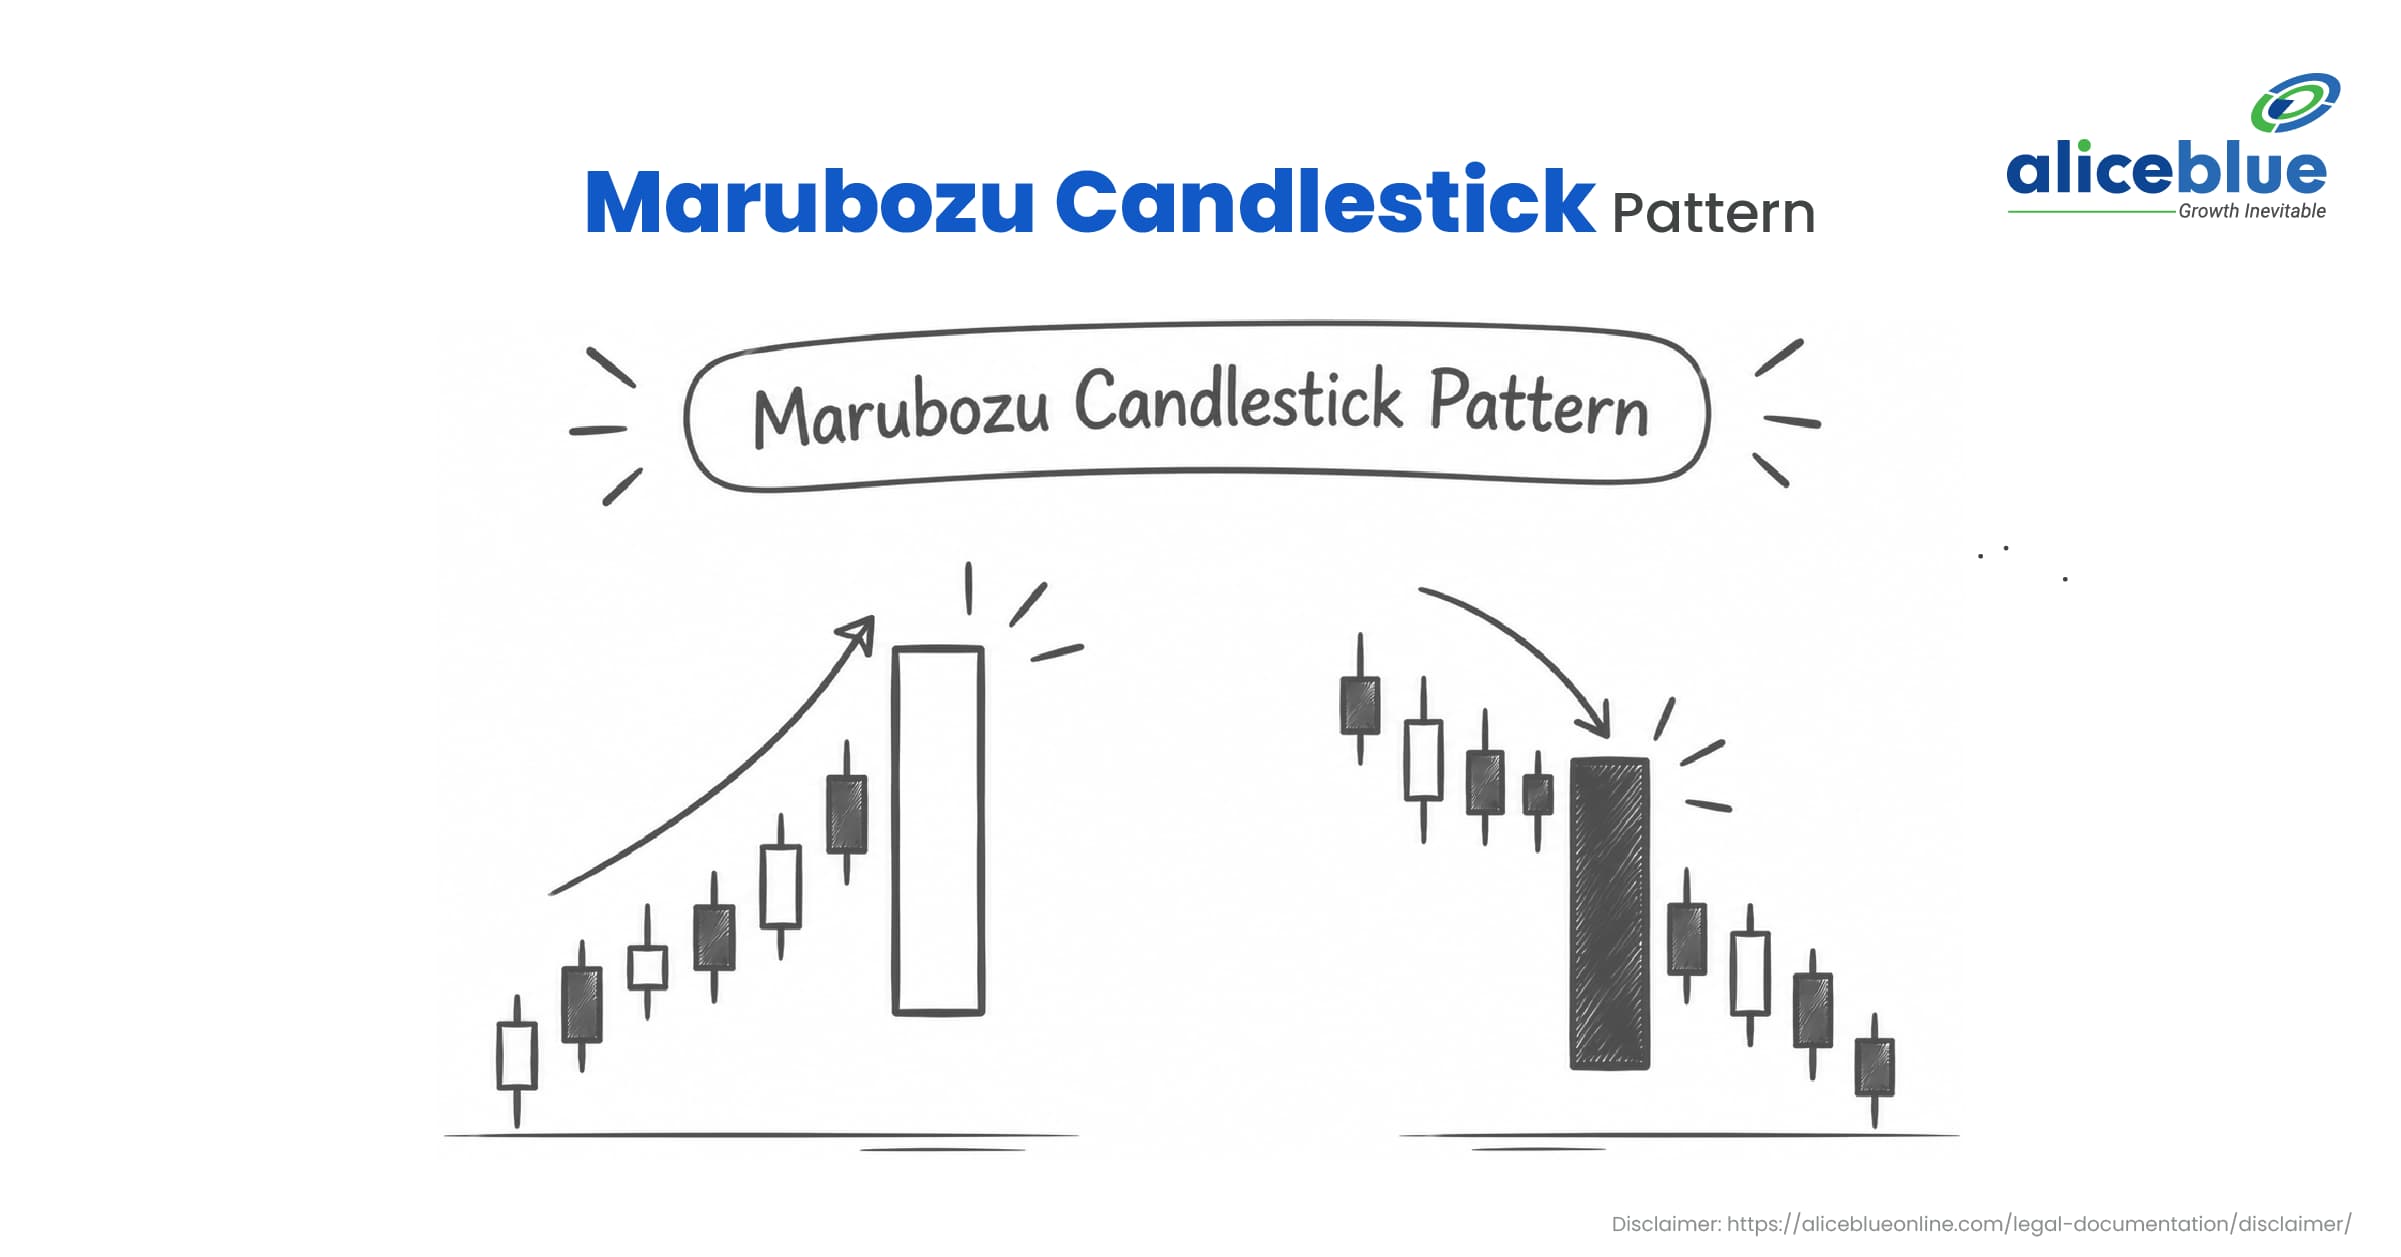
The Marubozu candlestick pattern is known for its long body and lack of wicks or shadows. It indicates strong buying or selling pressure during a trading session, depending on whether the candle is bullish or bearish.
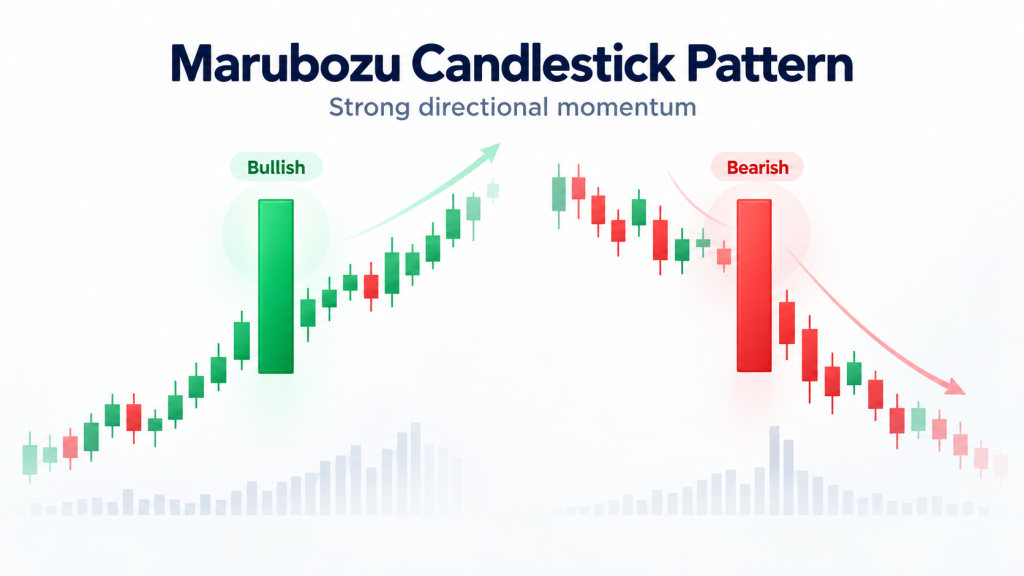
Quick Definition
A Marubozu is a candlestick pattern in which the opening and closing prices are at, or very close to, the session’s high and low. A bullish Marubozu indicates strong buying pressure, while a bearish Marubozu indicates strong selling pressure.

Table of Contents
- What Is a Marubozu Candlestick?
- Marubozu Candlestick Pattern Example
- How to Identify a Marubozu Candle
- Types of Marubozu Candlestick Patterns
- Importance of the Marubozu Pattern
- How to Trade Using a Marubozu Candlestick
- What Happens After a Marubozu Candle?
- Advantages and Limitations
- Marubozu Candlestick – Quick Summary
- Marubozu Candlestick Pattern – FAQs
What Is a Marubozu Candlestick?
A Marubozu is a candlestick pattern with little or no wick, meaning the opening and closing prices are at opposite ends of the candle’s price range. Its long body shows that the price moved substantially in one direction during the session.
There are two main types:
- Bullish Marubozu: The price opens at or near the session low and closes at or near the session high. It indicates strong buying pressure.
- Bearish Marubozu: The price opens at or near the session high and closes at or near the session low. It indicates strong selling pressure.
The pattern can appear during a trend or near a breakout level. Its meaning depends on the surrounding price action. A Marubozu may show strong momentum during one session, but it does not guarantee that the same direction will continue.
Marubozu Candlestick Pattern Example
Consider a stock that trades between ₹100 and ₹120 during a session.
Bullish Marubozu example:
- Opening price: ₹100
- Highest price: ₹120
- Lowest price: ₹100
- Closing price: ₹120
The candle opens at its low and closes at its high, forming a bullish Marubozu. This suggests that buyers maintained control throughout the session.
Bearish Marubozu example:
- Opening price: ₹120
- Highest price: ₹120
- Lowest price: ₹100
- Closing price: ₹100
The candle opens at its high and closes at its low, forming a bearish Marubozu. This suggests sustained selling pressure during the session.
These examples illustrate the candle structure. They do not predict what the stock will do in the next session.
How to Identify a Marubozu Candlestick?
Look for the following features when identifying a Marubozu:
- Long candle body: The difference between the opening and closing prices is relatively large.
- Little or no wick: The candle has no visible upper or lower shadow, or only very small shadows in less strict variations.
- Clear direction: A bullish candle closes above its open, while a bearish candle closes below its open.
- Strong price movement: The candle represents a substantial move in one direction during the session.
A candle does not have to be perfectly wick-free to be considered a Marubozu variation. Traders should also consider the candle’s size relative to recent candles and the broader market context.
Types of Marubozu Candlestick Patterns
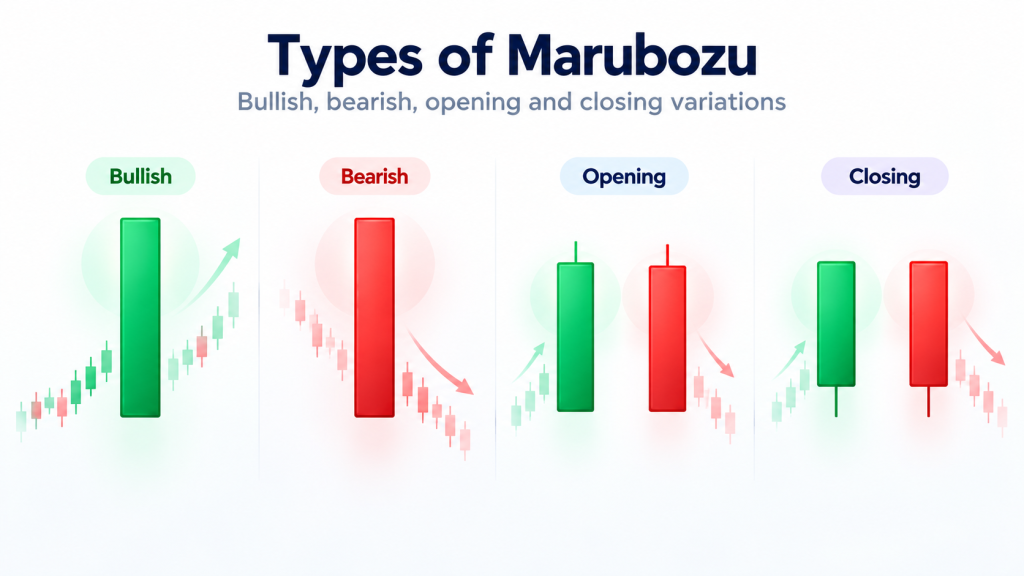
Marubozu patterns are commonly classified into bullish and bearish forms, along with variations based on which end of the candle has a wick.
1. Bullish Marubozu:
A bullish Marubozu has a long green or white body, with little or no wick at either end. The price opens at or near the session low and closes at or near the session high.
It indicates that buying pressure dominated the session. When it appears during an uptrend, it may reflect continued momentum. Near resistance, however, traders should assess whether the price can sustain the move.
2. Bearish Marubozu:
A bearish Marubozu has a long red or black body, with little or no wick at either end. The price opens at or near the session high and closes at or near the session low.
It indicates that selling pressure dominated the session. It may reflect continued weakness during a downtrend or a possible shift in sentiment if it appears after an uptrend.
3. Opening Marubozu:
An Opening Marubozu has no wick at the opening end of the candle but may have a wick at the closing end.
- Bullish Opening Marubozu: The price opens at the session low and rises, but may not close at the session high.
- Bearish Opening Marubozu: The price opens at the session high and falls, but may not close at the session low.
This variation suggests strong directional movement from the opening price, though some price movement against the direction may occur before the session ends.
4. Closing Marubozu:
A Closing Marubozu has no wick at the closing end but may have a wick at the opening end.
- Bullish Closing Marubozu: The price closes at the session high.
- Bearish Closing Marubozu: The price closes at the session low.
This variation indicates that the price finishes the session at an extreme, suggesting that buying or selling pressure persisted towards the close.
Importance of the Marubozu Candlestick Pattern
The Marubozu pattern helps traders assess the strength and direction of price movement during a session.
- Shows directional momentum: A long-bodied candle indicates a substantial move towards the close, either upward or downward.
- Helps assess breakouts: If a Marubozu forms as the price moves beyond support or resistance, traders can examine whether the breakout holds in subsequent sessions.
- Adds context to a trend: A bullish Marubozu during an uptrend or a bearish Marubozu during a downtrend may reflect continued directional pressure.
- Supports chart analysis: Traders can study the pattern alongside volume, moving averages and support or resistance levels to understand the price movement in context.
The pattern is not proof of institutional activity, a guaranteed breakout or a high-probability trade. Those conclusions require evidence beyond the candle itself.
How to Trade Using a Marubozu Candlestick Pattern?
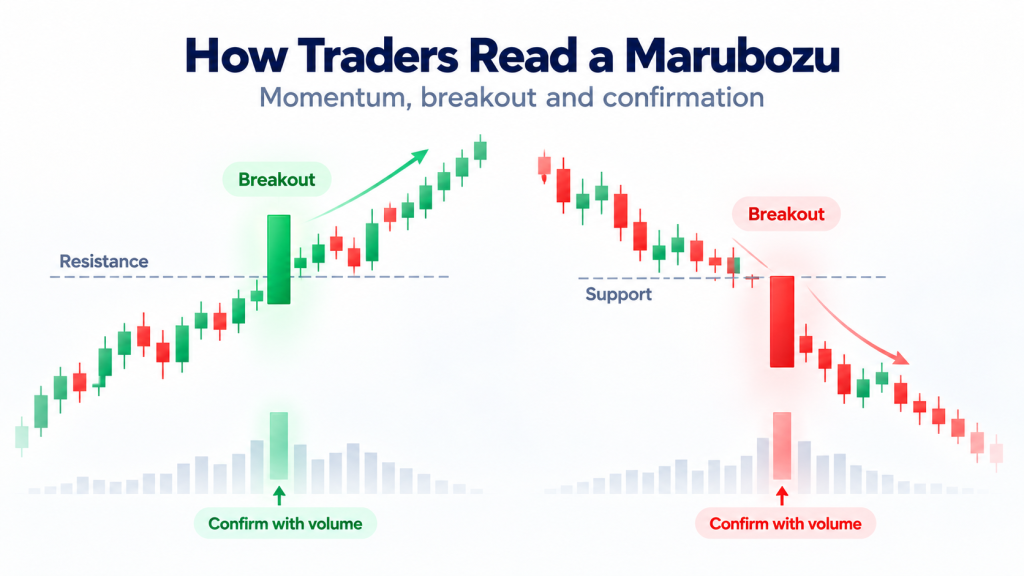
Traders may use a Marubozu as one part of their technical analysis. The following steps explain what to examine rather than prescribe a trade.
1. Identify the Market Trend:
Check whether the market is moving upward, downward or sideways. A bullish Marubozu during an uptrend may reflect buying momentum, while a bearish Marubozu during a downtrend may reflect continued selling pressure.
2. Check Support and Resistance:
Identify nearby support and resistance levels. A Marubozu that moves beyond a key level may indicate a possible breakout, but the price can also move back into its earlier range.
3. Examine Volume and Follow-Up Price Action:
Compare the candle’s trading volume with recent sessions and observe how the price behaves afterwards. Volume can provide additional context, but higher volume alone does not confirm that a move will continue.
Traders can review price charts and market data using a platform such as ANT Web by Alice Blue.
4. Consider Other Technical Tools:
Moving averages, RSI and MACD may help assess the broader trend or momentum. They should support the analysis rather than be treated as guarantees.
For more trading and investing topics, readers can explore the Alice Blue blog.
5. Plan Risk Management:
Before entering a trade, consider where the trade idea would no longer be valid, how much you can afford to risk and whether the potential reward justifies that risk. A Marubozu candle by itself does not determine the right entry, stop-loss or profit target.

What Happens After a Marubozu Candlestick?
There is no single outcome after a Marubozu candle. The next price movement depends on the market trend, the location of the candle and changing market conditions.
- After a bullish Marubozu: The price may continue rising if buying pressure persists. It may also pull back or consolidate, particularly near resistance.
- After a bearish Marubozu: The price may continue falling if selling pressure persists. It may also recover or consolidate near support.
- After a breakout: Traders can observe whether the price holds beyond the broken level or moves back into its previous range.
A strong candle describes what happened during that session. Subsequent price action helps traders assess whether the momentum is continuing.
Advantages and Limitations of the Marubozu Pattern
| Advantages | Limitations |
| Easy to recognise on a candlestick chart | Does not guarantee that the trend will continue |
| Shows the direction of strong price movement | Can appear near the end of a move |
| Can help identify possible breakouts | Breakouts may fail |
| Can be combined with other technical tools | Requires context from the broader chart |
| Can be observed across different timeframes | Shorter timeframes may contain more market noise |
Marubozu Candlestick – Quick Summary
The Marubozu candlestick pattern has a long body and little or no wick. A bullish Marubozu forms when the price opens at or near the session low and closes at or near the high. A bearish Marubozu forms when the price opens at or near the high and closes at or near the low.
The pattern indicates strong directional movement during a session. Traders may examine it alongside the prevailing trend, support and resistance, volume, and follow-up price action. It does not guarantee a continuation, reversal, or successful trade.
Marubozu Candlestick Pattern – FAQs
1. What is a Marubozu candlestick?
A Marubozu is a candlestick with a long body and little or no wick. It indicates strong directional price movement during a session, with the bullish version showing buying pressure and the bearish version showing selling pressure.
2. What is the significance of a Marubozu candle?
A Marubozu helps traders understand the direction and extent of price movement during a session. Its significance depends on whether it appears during a trend, near a support or resistance level, or as part of a possible breakout.
3. What is a Bullish Marubozu Opening?
A Bullish Opening Marubozu has no lower wick, meaning the price opens at the session low. The price then rises and may finish below the session high, leaving an upper wick.
4. How do you identify a Marubozu candle?
Look for a relatively long candle body with little or no wick. A bullish Marubozu closes at or near the session high, while a bearish Marubozu closes at or near the session low.
5. Is a Marubozu bullish or bearish?
It can be either. A bullish Marubozu indicates upward price movement, while a bearish Marubozu indicates downward price movement during the session.

Blog by Aliceblue News Desk
The Alice Blue Team is a passionate group of analysts delivering expert market insights, comprehensive coverage of stocks, economy, commodities, and personal finance through clear, actionable research.