Shooting Star Candlestick Pattern
Blog by Aliceblue News Desk
22 February 2025
11 minutes
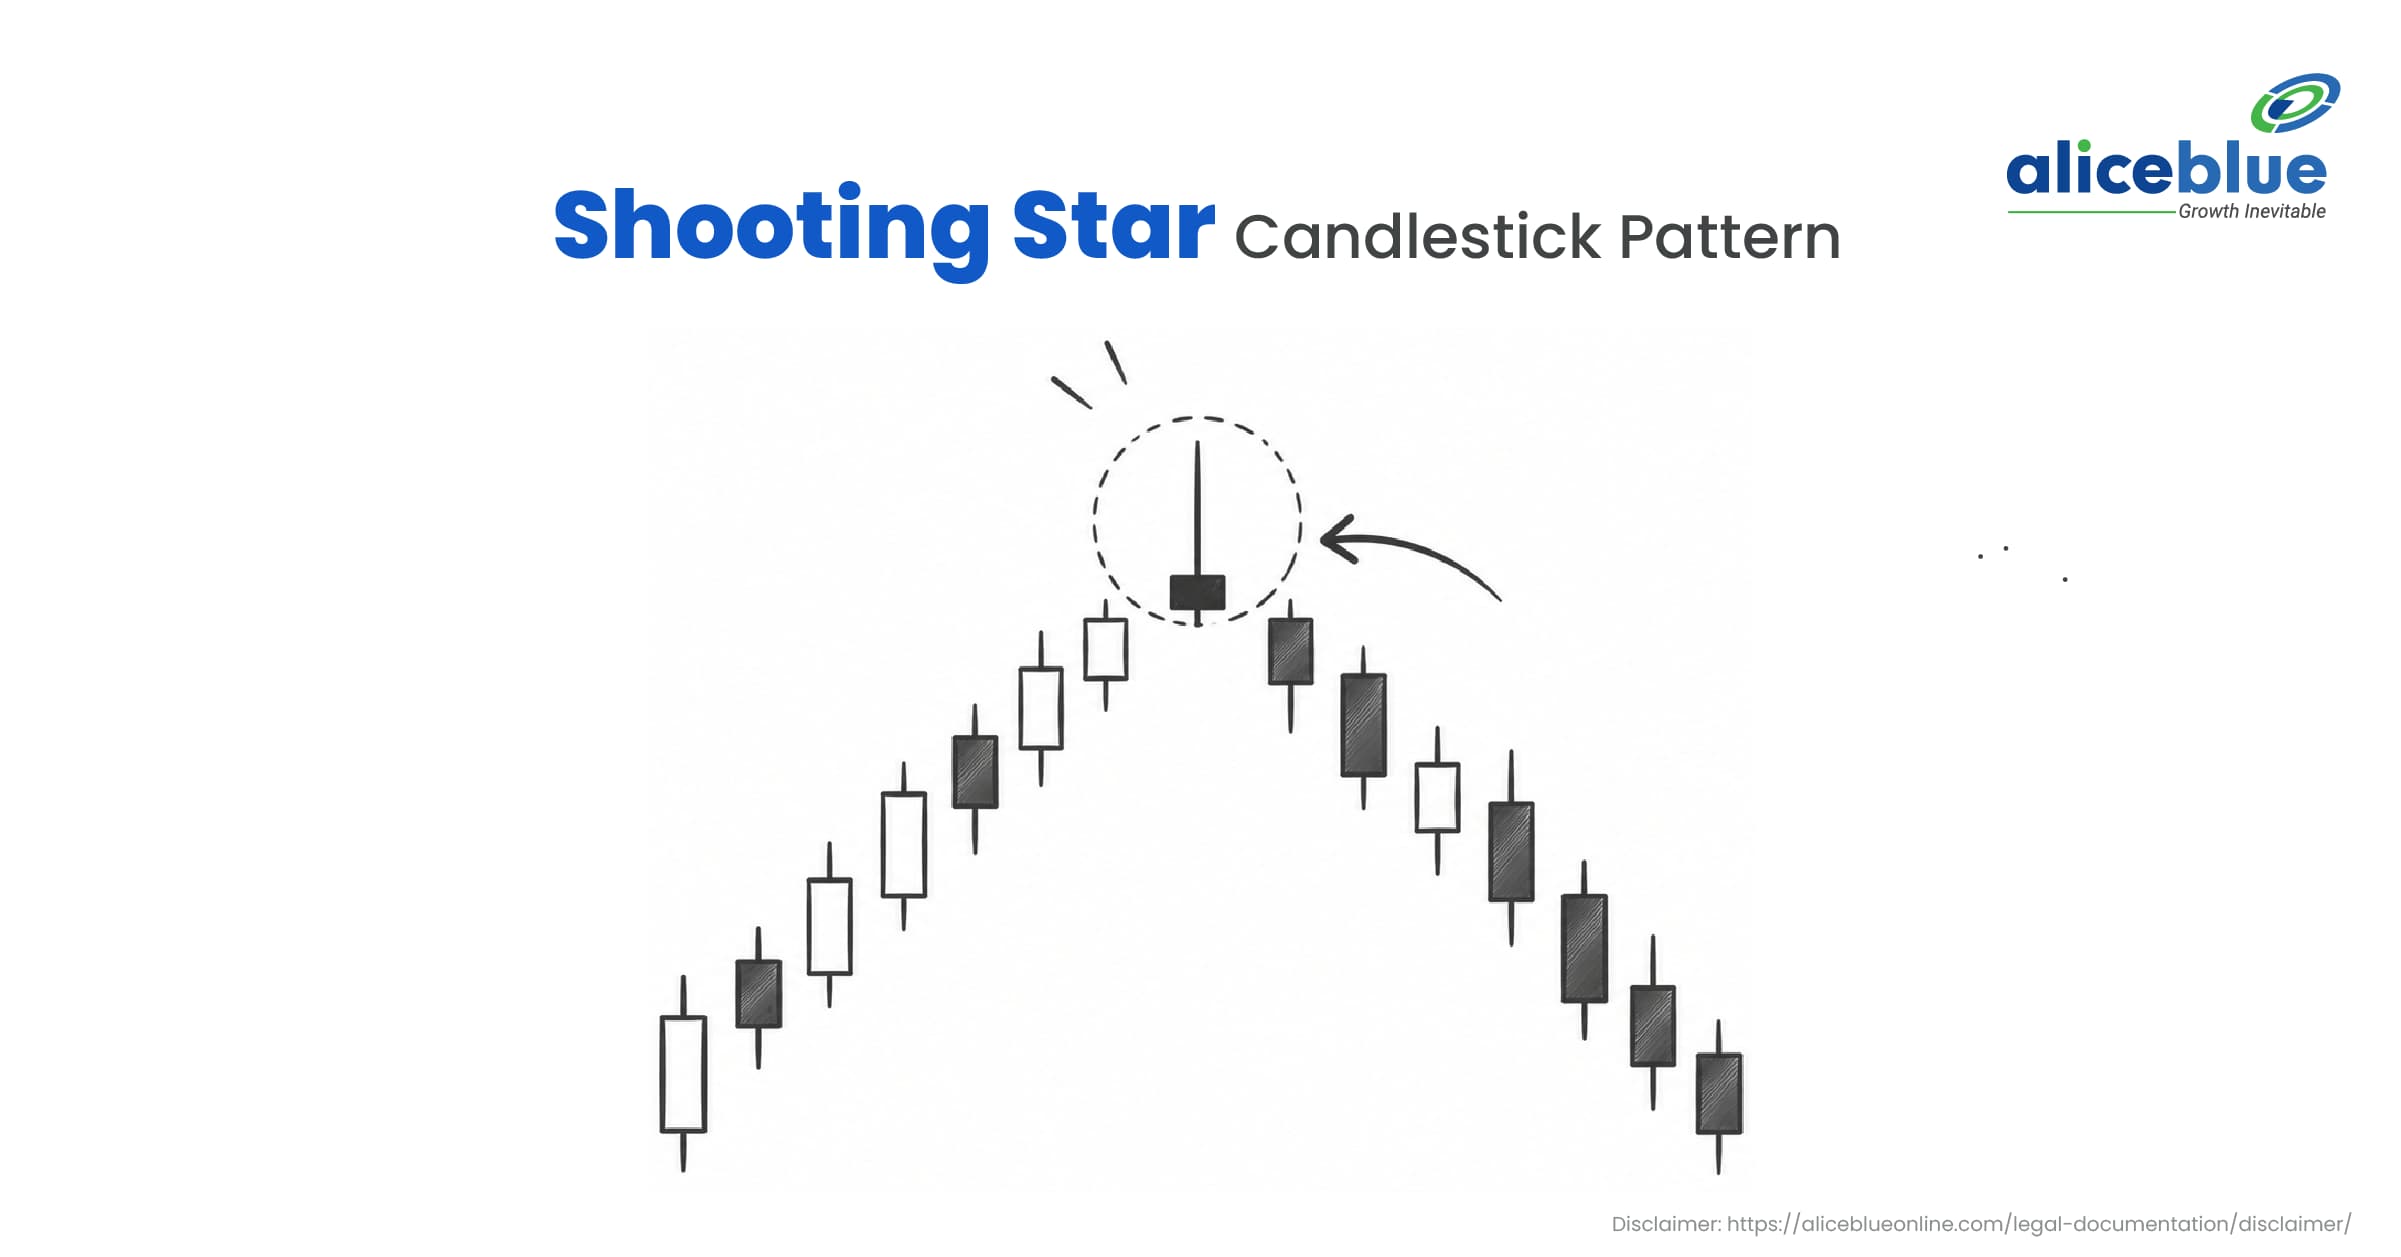
You have held a stock through a week of gains. Today it hit a new high, but the candle on your chart has a tiny body and a long thin line above it. Does that mean the rally is over?
It might. That shape is called a shooting star candlestick pattern. It is a single candle that forms after a price rise, where buyers push the price up but sellers drag it back down by the close. This guide explains how to spot it, test it against rules, and use it without over-trusting it.
A shooting star candlestick pattern is a single candle that appears after a price rise. It has a small body near the day’s low and an upper wick at least twice the body’s size. It shows that sellers rejected higher prices and signals a possible fall. Traders usually wait for the next candle to close lower before acting.
Table of Contents
- What Is a Shooting Star Candlestick Pattern?
- How Does the Shooting Star Pattern Work?
- How to Identify a Shooting Star Candle
- Shooting Star Pattern in the Stock Market: A Real Nifty 50 Candle
- How to Plan a Trade: Aggressive vs Conservative Entry
- Benefits of the Shooting Star Pattern
- Is the Shooting Star Pattern Reliable?
- Shooting Star vs Inverted Hammer vs Hanging Man
- Tips for Beginners
- Common Mistakes to Avoid
- Who Should Use the Shooting Star Pattern?
- Conclusion
- FAQs
What Is a Shooting Star Candlestick Pattern?
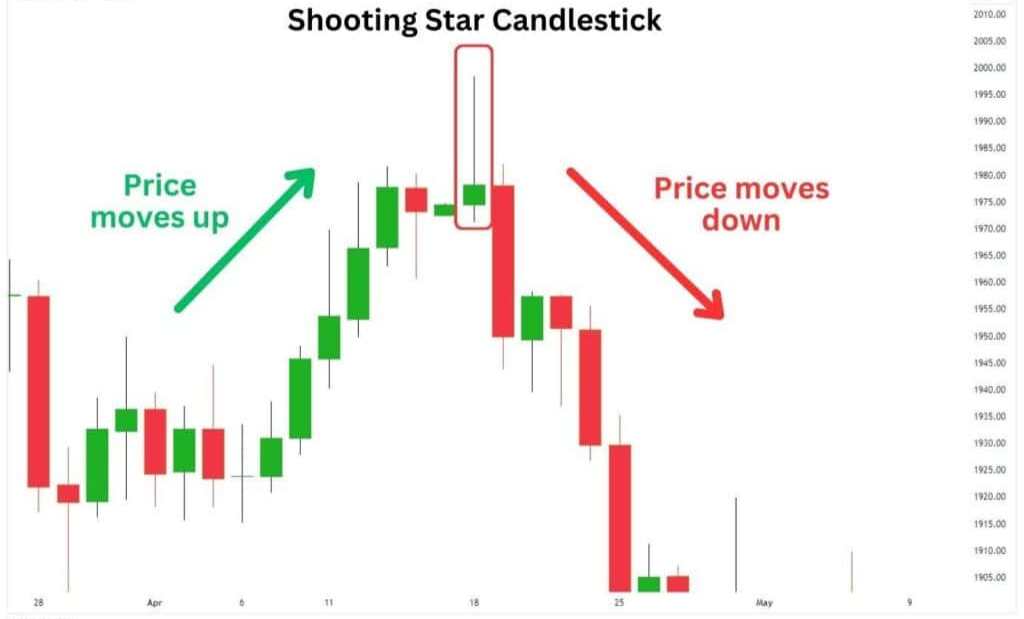
A financial chart diagram illustrating the Shooting Star candlestick pattern in gold prices, with green and red candlesticks showing an upward price trend followed by a highlighted tall red candle with a small body and long upper wick, annotated with arrows indicating price moving up before and down after the pattern.
It is a bearish reversal candle. “Bearish” means prices may fall. “Reversal” means the direction of the trend may change.
A candle on a chart records four prices for a period: open, high, low, and close. The thick part is the body, running from open to close. The thin lines above and below are wicks, which show how far the price travelled beyond the body.
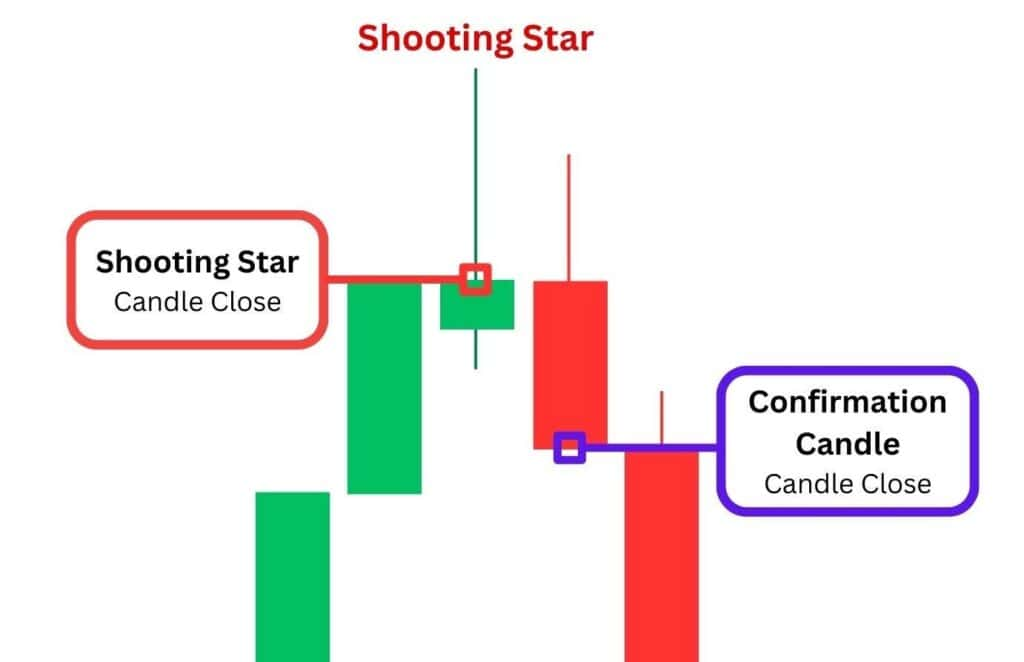
In a shooting star, the price jumps well above the open, then falls back. The long upper wick marks the spot where buyers ran out of strength. The usual description is a small body near the low, an upper wick at least twice the body, and almost no lower wick.

How Does the Shooting Star Pattern Work?
One trading day is a contest between buyers and sellers. Here is how it plays out:
- The stock is in an uptrend. An uptrend means the price keeps making higher highs and higher lows.
- The day opens firm. Buyers push the price up.
- The price hits a high. Early buyers book profit, and new sellers step in near the top.
- Sellers take over. The price slides back toward the opening level.
- The candle closes with a small body and a long upper wick. The wick records the prices that buyers could not hold.
- The next candle decides it. A close below the shooting star’s body supports the signal. A close above its high cancels it.
How to Identify a Shooting Star Candle
Use this checklist when studying a chart:
1. Check the previous trend
The pattern should appear after a visible rise. If the same shape appears after a price fall, it may be an inverted hammer instead.
2. Look for a small body
The opening and closing prices should be close to each other. The body can be red or green, although a red body may show slightly greater selling pressure.
3. Measure the upper wick
The upper wick should be much longer than the body. A commonly used rule is:
Upper wick ≥ 2 × candle body
For example, if the body is 10 points, the upper wick should ideally be at least 20 points.
4. Check the lower wick
A shooting star normally has a short lower wick. A long lower wick may indicate that the candle does not have a clean shooting star structure.
5. Check volume
Volume means the number of shares or contracts traded during the period. Higher-than-usual volume can make the signal more meaningful because it shows greater participation.
6. Look for resistance
A shooting star near a previous high, round-number level, or other resistance area may deserve more attention than one in the middle of a range.
Real Nifty 50 Example: 18 September 2023
The Nifty 50 chart provides an Indian-market example of a shooting-star-type candle.
The index had been moving higher from the beginning of August 2023. On 18 September 2023, the Nifty 50 recorded the following values:
| Price point | Value |
| Open | 20,155 |
| High | 20,195 |
| Low | 20,115 |
| Close | 20,133 |
Measuring the candle
The body was:
- Open: 20,155
- Close: 20,133
- Body size: 22 points
The upper wick was:
- High − Open
- 20,195 − 20,155 = 40 points
The lower wick was:
- Close − Low
- 20,133 − 20,115 = 18 points
The upper wick-to-body ratio was:
40÷22 ≈ 1.82
The upper wick was therefore about 1.82 times the body. This is slightly below the commonly used 2× guideline, so it should not be described as a textbook shooting star. A more accurate description is a shooting-star-type candle with a long upper wick.
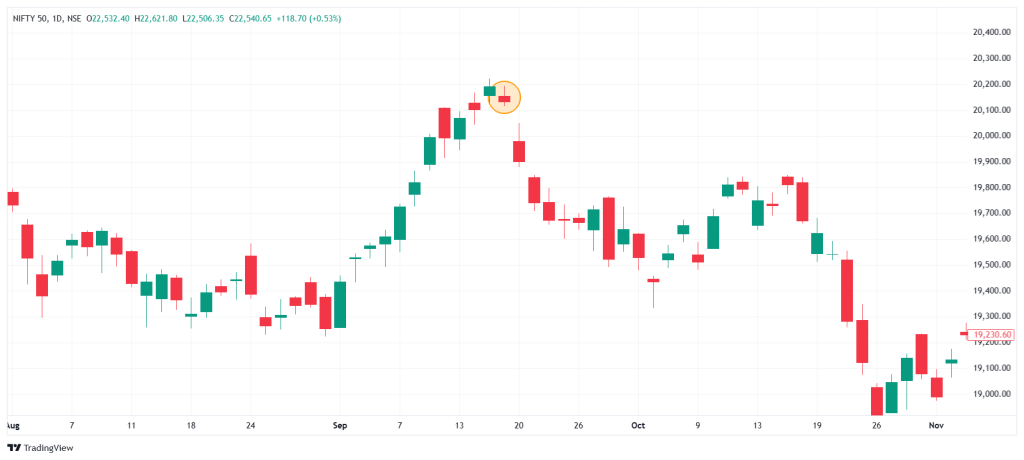
However, the broader chart context was important:
- The Nifty 50 had been rising from the start of August 2023.
- The candle appeared near the high of that upward move.
- The market began falling from around 20 September 2023.
- By 26 October 2023, the Nifty 50 closed at 18,857.
| Measurement | Value |
| 18 September close | 20,133 |
| 26 October close | 18,857 |
| Point decline | 1,276 points |
| Approximate decline | 6.34% |
The calculation is:
20,133 − 18,857 = 1,276 points
1,276 / 20,133 X 100 = 6.34%
This means the index fell by approximately 1,276 points, or 6.34%, between the 18 September closing level and the 26 October closing level.
The circled candle in the chart represents the Nifty 50 candle discussed in this example.
This example shows why traders should not judge a candlestick only by its appearance. The candle’s location after an uptrend and the price action that followed made it worth watching, but it was not a guaranteed sell signal.
How to Plan a Shooting Star Trade
The following example uses illustrative prices. It is not a recommendation.
Assume an NSE-listed stock rises from ₹1,000 to ₹1,100 over several sessions. Near a previous resistance level, it forms these prices:
| Price point | Value |
| Open | ₹1,102 |
| High | ₹1,130 |
| Low | ₹1,100 |
| Close | ₹1,104 |
The measurements are:
- Body: ₹2
- Upper wick: ₹26
- Lower wick: ₹2
- Upper wick-to-body ratio: 13 times
The candle meets the basic shape rules. If the next candle closes below ₹1,104, the bearish view receives confirmation.
A possible trade plan may look like this:
| Trade level | Price |
| Possible short entry after confirmation | ₹1,088 |
| Stop-loss above the candle high | ₹1,131 |
| Possible target | ₹1,020 |
| Risk per share | ₹43 |
| Potential reward per share | ₹68 |
| Risk-reward ratio | Approximately 1:1.6 |
A stop-loss is an order that exits a trade if the price moves against you. Here, it is placed above the shooting star’s high.
For 100 shares:
- Maximum planned loss: ₹43 × 100 = ₹4,300
- Potential planned gain: ₹68 × 100 = ₹6,800
Brokerage, taxes, and other trading costs are not included.
Aggressive and conservative entries
| Entry style | When it is used | Main drawback |
| Aggressive | Near the shooting star’s closing price | More false signals |
| Conservative | After the next candle closes lower | Entry may be at a less favourable price |
Short selling means selling first and buying later, hoping to benefit from a price fall. In the cash segment, short selling is generally limited to the same trading day. Holding a short position overnight requires a suitable derivatives position, such as futures, subject to applicable rules and risks.
If you already own shares for delivery, you can use the pattern as a signal to review the position, book partial profits, or tighten your stop-loss. You do not need to short the stock.
Benefits of the Shooting Star Pattern
- You may see weakness one or two candles before a larger fall.
- The candle’s high gives a clear price for the stop-loss.
- A shareholder can use it to sell part of a position instead of guessing.
- It shows up on 15-minute, daily, and weekly charts.
- One candle is easier to read than a three-candle pattern.
Is the Shooting Star Pattern Reliable?
On its own, no. It improves when other signals line up.
- Strong stocks ignore it. A stock in a steady, strong rally can print a shooting star and keep rising.
- Timeframe matters. A daily or weekly shooting star carries more weight than a 5-minute one.
- Thin trading distorts wicks. In small, illiquid stocks, a few trades can create a long wick. Liquid stocks have many buyers and sellers each day.
- Leverage magnifies errors. Futures let you hold a large position with a small deposit, so a wrong call costs more.
- Pattern fever. After learning the shape, many beginners see it everywhere. Not every long upper wick qualifies, as the Nifty example above shows.
Shooting Star vs Inverted Hammer vs Hanging Man
Three candles look alike. The trend before them and the wick position tell them apart.
| Parameter | Shooting star | Inverted hammer | Hanging man |
| Trend before it | Uptrend | Downtrend | Uptrend |
| Long wick | Upper | Upper | Lower |
| Signal | Possible fall | Possible rise | Possible fall |
| Next-candle check | Closes lower | Closes higher | Closes lower |
Tips for Beginners
- Measure the wick and body. If the ratio is below 2, treat the candle as a maybe.
- Confirm the uptrend before you name the candle.
- Check volume against the last few sessions.
- Set the stop-loss before you place the order.
- Risk no more than 1% of your trading capital per trade. On a ₹1,00,000 account, that is ₹1,000.
- Pair the candle with one more tool. The Relative Strength Index (RSI) scores how fast the price has moved on a 0 to 100 scale. A reading above 70 suggests the stock has risen quickly.

Common Mistakes to Avoid
- Calling every long upper wick a shooting star. Measure it. The Nifty example above was close but did not pass.
- Ignoring the trend. The same shape in a sideways or falling market means little.
- Skipping the stop-loss. A failed pattern can run well past the high.
- Picking illiquid stocks. Wide gaps between buy and sell prices distort the wick.
- Oversizing. A large position turns a normal miss into a painful loss.
- Reading one timeframe. A 5-minute shooting star inside a strong daily uptrend is weak. Check the daily chart.
Who Should Use the Shooting Star Pattern?
It suits:
- Swing traders, who hold positions for a few days to a few weeks
- Intraday traders who track resistance levels
- Investors who want a signal for booking partial profits
It suits less:
- Long-term investors who judge a company by earnings and growth
- New learners who have not studied trends, support and resistance
- People who cannot watch the market or follow a stop-loss
To practise on live charts, you can open an account with Alice Blue.
Conclusion
A shooting star shows that buyers pushed a stock up and sellers dragged it back by the close. After a rally, that can mean the move is losing steam. The Nifty 50 candle from 25 June 2026 shows the catch: the shape looked right, but the wick fell just under the 2× rule and the trend was a bounce, not a clean rise. Measure the candle, check the trend and volume, and set your stop-loss and size before you trade. No clear test, no trade.
Frequently Asked Questions
1. What is a shooting star candlestick pattern?
It is a single-candle pattern that forms after a price rise. It has a small body and a long upper wick. It suggests sellers rejected higher prices and a fall may follow.
2. Is the shooting star bullish or bearish?
It is bearish. It signals that buying strength is fading at the top of a move. A lower close on the next day adds weight to it.
3. How do you identify a shooting star candle on a chart?
Look for a rising stock, then a candle with a small body near its low. The upper wick should be at least twice the body, with almost no lower wick. Check volume and the next candle.
4. What is the difference between a shooting star and an inverted hammer?
The shapes match, but the trend before them differs. A shooting star follows a rise and is bearish, while an inverted hammer follows a fall and is bullish.
5. Is the shooting star pattern reliable?
It works better near resistance, on high volume, and on daily or weekly charts. On its own, it fails often. Use it with another indicator.
6. Where should I place the stop-loss for a shooting star trade?
Place it just above the candle’s high. A close above that level means the bearish view has failed.

Blog by Aliceblue News Desk
The Alice Blue Team is a passionate group of analysts delivering expert market insights, comprehensive coverage of stocks, economy, commodities, and personal finance through clear, actionable research.