Stochastic Oscillator Vs RSI
Blog by Aliceblue News Desk
25 June 2024
7 minutes
The Stochastic Oscillator and Relative Strength Index (RSI) are both momentum indicators used in technical analysis. While both can help identify overbought and oversold conditions, they use different calculations and look at price movement in different ways.
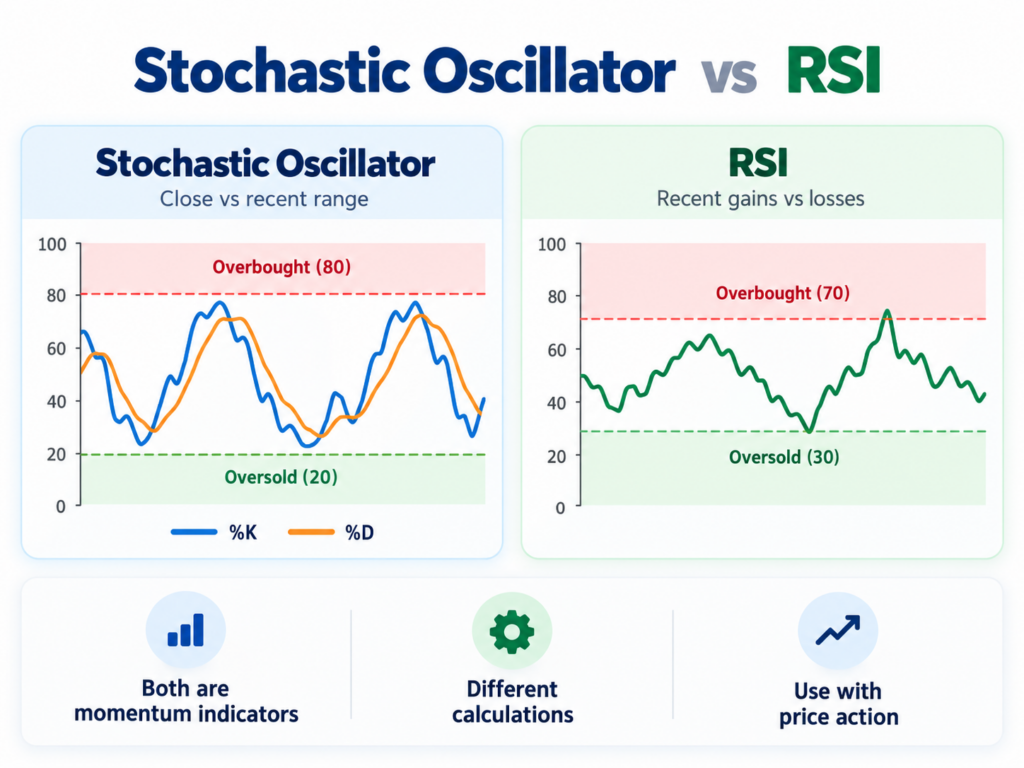
Quick Definition
RSI measures the magnitude of recent price gains and losses on a scale of 0 to 100.
Stochastic Oscillator compares the current closing price with the recent high-low price range, also on a scale of 0 to 100.
Both indicators can be used to study momentum, but neither should be treated as a standalone signal for buying or selling.

Relative Strength Index Meaning
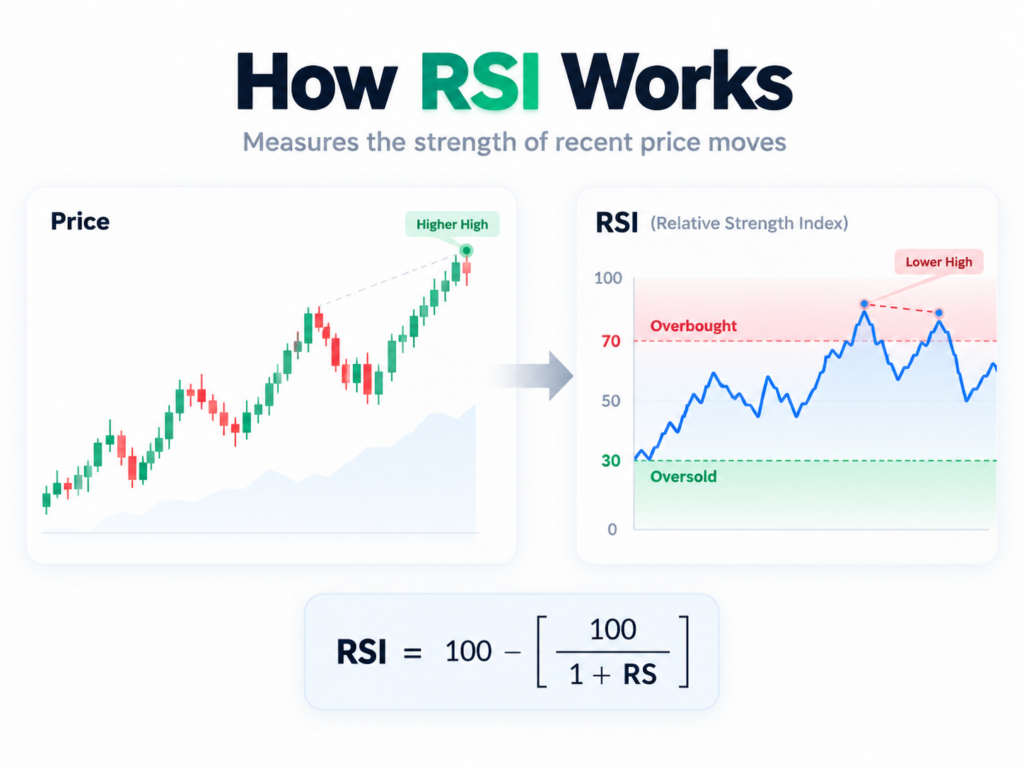
The Relative Strength Index (RSI) is a momentum indicator that measures the magnitude of recent price gains and losses.
RSI ranges from 0 to 100. A reading above 70 is commonly considered overbought, while a reading below 30 is commonly considered oversold.
The standard RSI period is 14, although traders may use different periods depending on their analysis.
The basic RSI formula is:
RSI = 100 − [100 / (1 + RS)]
Where:
RS = Average Gain / Average Loss
RSI can be used to study momentum, overbought and oversold conditions, and divergences between price and the indicator.
What Is Stochastic Oscillator?
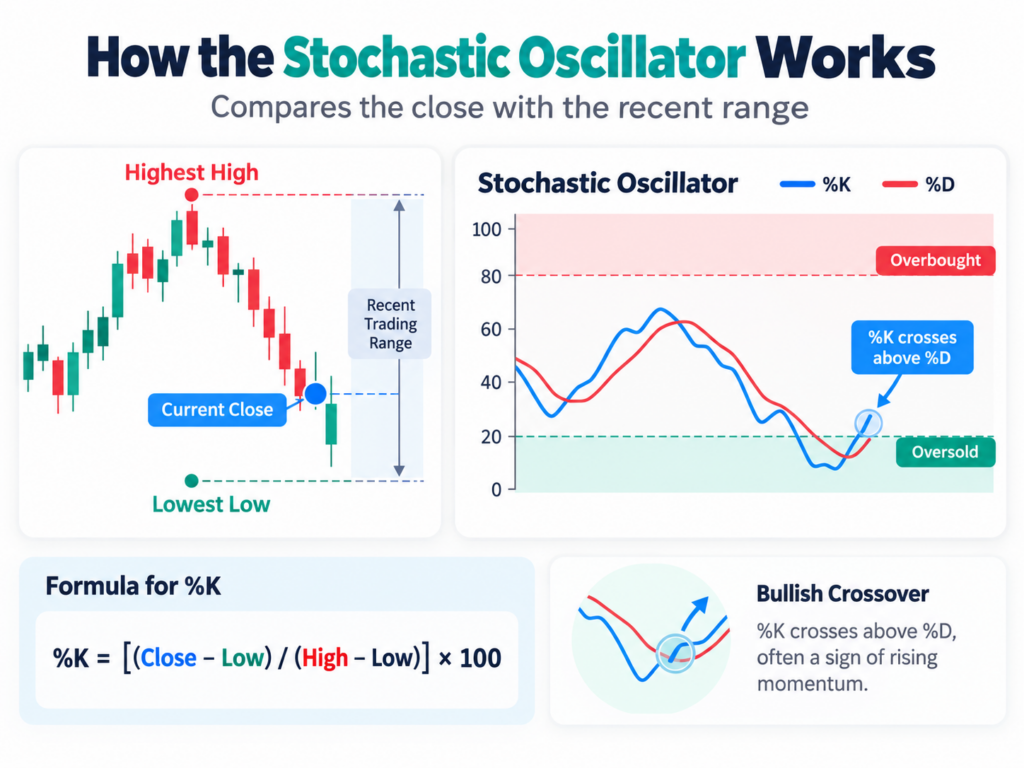
The Stochastic Oscillator is a momentum indicator that compares a security’s closing price with its recent high-low range.
It was developed by George Lane in the late 1950s and generally consists of two lines:
- %K: The main Stochastic line
- %D: A moving average of %K, commonly calculated over three periods
The indicator ranges from 0 to 100.
- Above 80: Commonly considered overbought
- Below 20: Commonly considered oversold
The basic %K formula is:
%K = [(Current Close − Lowest Low) / (Highest High − Lowest Low)] × 100
The Stochastic Oscillator is often used to study momentum, overbought and oversold conditions, and crossovers between the %K and %D lines.
Stochastic Oscillator vs RSI
The main difference is in what each indicator compares.
The Stochastic Oscillator compares the current closing price with the recent price range, while RSI measures the magnitude of recent upward and downward price movements.
| Parameter | Stochastic Oscillator | RSI |
| Indicator type | Momentum indicator | Momentum indicator |
| Calculation basis | Compares closing price with the recent high-low range | Compares the magnitude of recent gains and losses |
| Scale | 0 to 100 | 0 to 100 |
| Common overbought level | Above 80 | Above 70 |
| Common oversold level | Below 20 | Below 30 |
| Standard period | 14 periods is commonly used | 14 periods is commonly used |
| Main lines | %K and %D | RSI line |
| Common uses | Momentum, overbought/oversold conditions, crossovers | Momentum, overbought/oversold conditions, divergences |
| Sensitivity | Can respond quickly to changes in the recent price range | Reflects the balance between recent gains and losses |
The Difference in Simple Terms
Think of them as answering different questions.
Stochastic Oscillator:
“Where is the current closing price compared with the recent trading range?”
RSI:
“How strong have recent upward and downward price movements been?”
This is why both indicators can sometimes show different readings for the same stock.
Importance of Relative Strength Index
RSI can be useful for studying momentum and identifying unusually strong or weak recent price movement.
- Identifies Overbought and Oversold Conditions: RSI readings above 70 and below 30 are commonly used as reference levels for overbought and oversold conditions. However, these levels do not automatically indicate that a reversal will occur.
- Helps Study Momentum: RSI can show whether recent price gains or losses are becoming stronger or weaker.
- Can Be Used to Study Divergence: Traders may compare RSI movement with price movement. For example, if price makes a new high while RSI does not make a corresponding high, this may be studied as a bearish divergence. Similarly, a lower price low accompanied by a higher RSI low may be studied as bullish divergence. Divergence is not a guaranteed reversal signal and requires further analysis.
- Works Across Different Timeframes: RSI can be applied to intraday charts as well as daily, weekly and other longer-term charts.
Importance of Stochastic Oscillator
The Stochastic Oscillator can help traders study where the current closing price sits within its recent price range.
- Identifies Overbought and Oversold Conditions: Readings above 80 or below 20 are commonly used to identify extreme positions within the indicator’s range.
- Helps Study Short-Term Momentum: Movement in the %K and %D lines can provide information about changes in short-term momentum.
- %K and %D Crossovers: A crossover between %K and %D is commonly monitored as a possible change in momentum. For example, a %K line crossing above %D near the lower end of the range may attract attention from traders looking for improving momentum.
- Can Be Used for Divergence Analysis: Like RSI, the Stochastic Oscillator can also be compared with price to study possible divergence.

RSI vs Stochastic Oscillator: Which One Should You Use?
There is no universal answer because the two indicators measure different aspects of price movement.
A trader may prefer RSI when they want to study the strength of recent gains and losses.
The Stochastic Oscillator may be useful when they want to study the current closing price in relation to its recent trading range.
They can also be used together, but using two indicators does not automatically make a trading signal more reliable. Since both are momentum indicators, they can sometimes provide similar information.
Using RSI and Stochastic Oscillator Together
RSI and Stochastic can be used together as part of a broader technical analysis setup.
For example, a trader could observe:
- The overall price trend.
- The RSI reading.
- The Stochastic %K and %D lines.
- Support and resistance levels.
- Price action around important levels.
Suppose a stock is trading near a known support level.
RSI is below 30, while the Stochastic Oscillator is also below 20. The trader may then examine whether price is actually showing signs of stabilising or changing direction.
The indicators provide context, but they do not confirm that the price will reverse.
Stochastic Oscillator vs RSI – Quick Summary
- RSI and the Stochastic Oscillator are both momentum indicators.
- RSI measures the magnitude of recent gains and losses.
- The Stochastic Oscillator compares the current closing price with the recent high-low range.
- RSI commonly uses 70 and 30 as overbought and oversold reference levels.
- Stochastic commonly uses 80 and 20.
- RSI is often used to study momentum, overbought/oversold conditions and divergence.
- Stochastic is commonly used to study momentum, overbought/oversold conditions and %K/%D crossovers.
- Both indicators can remain in overbought or oversold zones during strong trends.
- Neither indicator should be treated as a guaranteed buy or sell signal.
- RSI and Stochastic can be used together, but they should be considered alongside price action and the broader market setup.
Relative Strength Index vs Stochastic Oscillator – FAQs
1. What is the difference between Stochastic Oscillator and RSI?
The Stochastic Oscillator compares the current closing price with the recent high-low range, while RSI measures the magnitude of recent gains and losses.
2. How do you read RSI?
RSI ranges from 0 to 100. Readings above 70 are commonly considered overbought, while readings below 30 are commonly considered oversold. These levels are reference points and do not automatically predict a price reversal.
3. How is RSI calculated?
The basic RSI formula is:
RSI = 100 − [100 / (1 + RS)]
Where:
RS = Average Gain / Average Loss
The standard RSI period is commonly 14 periods.
4. What is the Stochastic Oscillator formula?
The basic %K formula is:
%K = [(Current Close − Lowest Low) / (Highest High − Lowest Low)] × 100
The %D line is commonly calculated as a 3-period moving average of %K.
5. Can RSI and Stochastic be used together?
Yes. They can be used together to study different aspects of momentum. However, both are momentum indicators, so using both does not automatically confirm a trade. Price action, trend and other technical factors should also be considered.

Blog by Aliceblue News Desk
The Alice Blue Team is a passionate group of analysts delivering expert market insights, comprehensive coverage of stocks, economy, commodities, and personal finance through clear, actionable research.