What is Pivot Point?
Blog by Aliceblue News Desk
12 November 2024
9 minutes

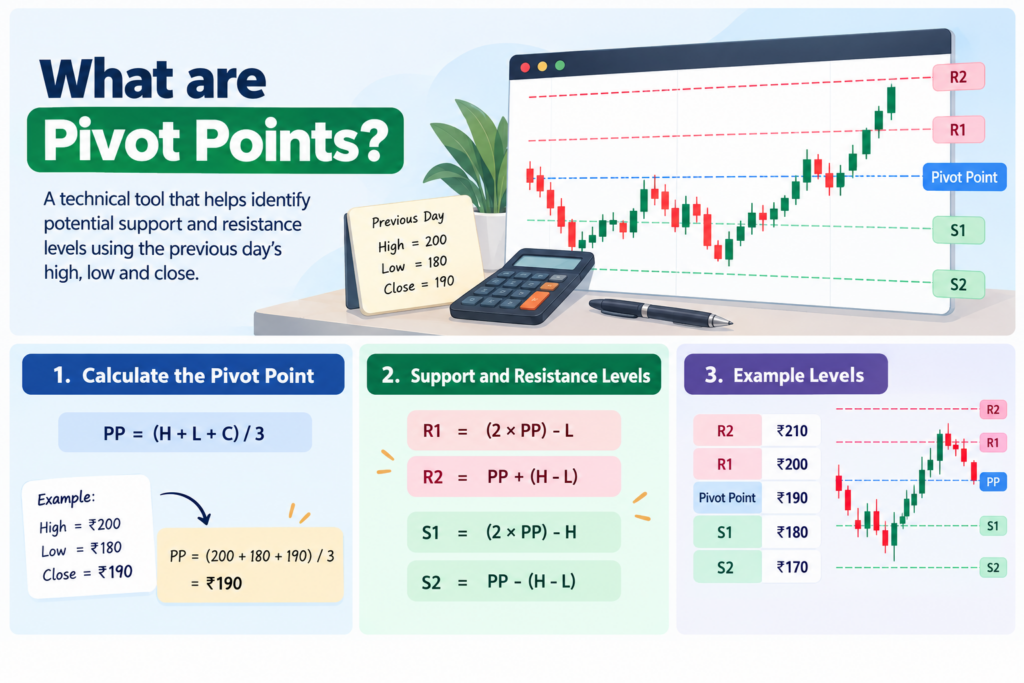
A Pivot Point is a technical analysis tool used to identify potential support and resistance levels based on the previous trading period’s high, low, and closing prices. It is commonly used by intraday traders to study price levels and market direction.
Quick Definition
A Pivot Point is a calculated price level used as a reference for identifying potential support, resistance, and market direction. The standard Pivot Point is calculated using the previous period’s high, low, and closing prices.
Traders can use the Pivot Point along with price action, volume, and other technical indicators to analyse possible entry and exit areas.

Pivot Point Meaning
A Pivot Point is a technical analysis indicator that provides a reference level for the current trading session using price data from the previous period.
The standard Pivot Point uses three values:
- Previous period’s High
- Previous period’s Low
- Previous period’s Close
From the central Pivot Point, traders can calculate additional support and resistance levels such as S1, S2, R1 and R2.
These levels can help traders study where price may find support, face resistance or change direction. However, a Pivot Point does not predict future price movements with certainty.
Pivot Points are commonly used for intraday analysis, particularly when traders want predefined price levels to monitor during a trading session.
Pivot Point Example
Suppose a stock had the following prices on the previous trading day:
- High = ₹200
- Low = ₹180
- Close = ₹190
The standard Pivot Point is:
PP = (H + L + C) / 3
PP = (200 + 180 + 190) / 3
PP = ₹190
Now, the support and resistance levels can be calculated.
Support 1
S1 = (2 × PP) – H
S1 = (2 × 190) – 200
S1 = ₹180
Support 2
S2 = PP – (H – L)
S2 = 190 – (200 – 180)
S2 = ₹170
Resistance 1
R1 = (2 × PP) – L
R1 = (2 × 190) – 180
R1 = ₹200
Resistance 2
R2 = PP + (H – L)
R2 = 190 + (200 – 180)
R2 = ₹210
So, the levels are:
| Level | Price |
| R2 | ₹210 |
| R1 | ₹200 |
| Pivot Point | ₹190 |
| S1 | ₹180 |
| S2 | ₹170 |
If the stock opens around ₹190 and starts moving higher, traders may watch ₹200 and ₹210 as potential resistance areas. If price moves lower, ₹180 and ₹170 may be monitored as potential support areas.
These levels are reference points, not guaranteed reversal or breakout levels.
Pivot Point Formula
The standard Pivot Point formula is:
PP = (H + L + C) / 3
Where:
- PP = Pivot Point
- H = Previous period’s High
- L = Previous period’s Low
- C = Previous period’s Close
The standard support and resistance formulas are:
S1 = (2 × PP) – H
S2 = PP – (H – L)
R1 = (2 × PP) – L
R2 = PP + (H – L)
These calculations create a central Pivot Point along with two commonly used support and two resistance levels.
Other Types of Pivot Points
The Standard Pivot Point is not the only method available.
Other variations include:
- Fibonacci Pivot Points
- Woodie’s Pivot Points
- Camarilla Pivot Points
- DeMark’s Pivot Points
These methods use different calculations or weight different price values.
For beginners, understanding the standard Pivot Point formula is a useful starting point before exploring other variations.
Watch to know How Pivot Points Help You Find Entry & Exit Zones?
How to Calculate Pivot Points?
Calculating a standard Pivot Point involves three basic steps.
Step 1: Collect Previous Period Data
Take the previous trading period’s:
- High
- Low
- Close
For daily intraday Pivot Points, traders generally use the previous trading day’s data.
Step 2: Calculate the Pivot Point
Use:
PP = (H + L + C) / 3
This gives the central Pivot Point for the next trading session.
Step 3: Calculate Support and Resistance
Use the Pivot Point along with the previous high and low to calculate S1, S2, R1, and R2.
Most trading platforms can calculate these levels automatically, so traders generally do not need to calculate them manually.
Daily, Weekly and Monthly Pivot Points
Pivot Points can be calculated using different time periods.
For example:
- Daily Pivot Points: Use the previous day’s data.
- Weekly Pivot Points: Use the previous week’s data.
- Monthly Pivot Points: Use the previous month’s data.
The choice of timeframe depends on the trader’s approach. Intraday traders commonly monitor daily Pivot Points, while longer-term traders may also look at weekly or monthly levels.
How to Read Pivot Points?
The relationship between price and the central Pivot Point can provide a simple reference for intraday analysis.
Price Above the Pivot Point:
If price is trading above the Pivot Point, some traders may consider the market to have a bullish intraday bias.
However, price being above the Pivot Point alone does not confirm that an uptrend will continue.
Price Below the Pivot Point:
If price is trading below the Pivot Point, some traders may consider the market to have a bearish intraday bias.
Again, the Pivot Point should be considered along with price action and other market information.
Price Around the Pivot Point:
When price repeatedly moves around the Pivot Point, the market may not have a clear directional move.
Traders can then watch how price reacts around the level rather than assuming that a breakout or reversal will occur.
Importance of Pivot Points
Pivot Points can be useful because they provide predefined price levels that traders can monitor during a trading session.
- Identifying Potential Support and Resistance: S1 and S2 can act as reference levels below the Pivot Point, while R1 and R2 can act as reference levels above it.
- Understanding Intraday Direction: The relationship between the current price and Pivot Point can help traders form a basic view of short-term market direction.
- Planning Trades: Traders can use Pivot Points to identify areas they want to monitor before entering a trade. For example, a trader may wait for price to react near R1 rather than entering a position in the middle of a price range.
- Setting Risk Levels: Pivot levels can also be considered when planning stop-loss and exit levels. The actual level used should depend on the trading setup and the amount of risk the trader is willing to take.
Benefits of Pivot Points
Some benefits of using Pivot Points include:
- Easy to Calculate: The standard Pivot Point uses only the previous period’s high, low, and closing prices.
- Clear Reference Levels: The calculated levels provide specific prices that traders can monitor instead of relying only on visual interpretation of a chart.
- Useful for Intraday Analysis: Daily Pivot Points provide levels that can be monitored throughout the trading session.
- Can Be Combined With Other Tools: Pivot Points can be used along with price action, volume, moving averages, RSI, and other technical analysis tools.
- Applicable Across Markets: Pivot Points can be used to analyse various tradable instruments, provided suitable price data is available.
Limitations of Pivot Points
Pivot Points are useful reference levels, but they have limitations.
- Based on Historical Price Data: The calculation uses previous period data. It does not include future information, so the resulting levels cannot guarantee how price will behave.
- False Breakouts Can Occur: Price can move through a Pivot Point or support/resistance level and then reverse. A break of R1, for example, does not guarantee that price will continue towards R2.
- Less Reliable During Sudden Price Moves: Major news, unexpected announcements, or sharp market movements can cause price to move rapidly through several Pivot levels.
- Does Not Consider Fundamentals: The standard Pivot Point is calculated only from price data. It does not consider earnings, economic data, company announcements or other fundamental factors.
- Should Not Be Used Alone: A Pivot Point is a reference tool, not a complete trading system. Traders may combine it with price action, volume, and other forms of analysis before making a trading decision.

Pivot Point Trading Strategy
A Pivot Point trading approach generally involves observing how price behaves around the calculated levels.
1. Pivot Point Breakout:
A trader may watch for price to move above the central Pivot Point or an established resistance level.
For example, if price breaks above R1 and holds above it, a trader may monitor whether the move continues towards R2.
A breakout should not be assumed to be valid simply because price crosses a level. Volume and price behaviour can provide additional context.
2. Support and Resistance Bounce:
Traders may watch how price reacts near S1, S2, R1, or R2.
For example, if price approaches S1 and shows signs of holding the level, a trader may study the price action for a possible bounce.
Similarly, a rejection near R1 may become an area for further analysis.
3. Pivot Point Reversal:
A reversal setup can occur when price moves towards a Pivot level and then changes direction.
For example, price may move below the central Pivot Point and then recover above it.
Rather than treating this as an automatic buy or sell signal, traders can look for confirmation from price structure, volume, or another indicator.
4. Combining Pivot Points With Other Indicators:
Pivot Points can be combined with tools such as:
- Moving averages
- RSI
- VWAP
- Volume
- Candlestick patterns
- Support and resistance
Using multiple forms of analysis can provide additional context, but it does not eliminate the risk of a false signal.
Risk Management When Using Pivot Points
Pivot Points identify price levels, but they do not determine how much a trader should risk.
Before entering a trade, traders should consider:
- Entry price
- Stop-loss level
- Position size
- Target or exit level
- Transaction costs
- Market conditions
For example, if a trader enters near S1 and places a stop-loss below the level, the distance between the entry and stop-loss can be considered when deciding position size.
This helps keep the amount at risk within a predefined limit.
Pivot Points: Quick Summary
Pivot Points are technical analysis tools that use previous period price data to calculate a central reference level along with potential support and resistance levels.
The standard formula is:
PP = (H + L + C) / 3
From this, traders can calculate S1, S2, R1 and R2.
Pivot Points are commonly used in intraday trading to monitor price behaviour around predefined levels. Traders may use them for breakout, bounce, or reversal setups and combine them with price action, volume, or other indicators.
However, Pivot Points do not predict price movements with certainty. False breakouts can occur, and sudden market movements can cause price to move quickly through calculated levels.
Pivot Point Meaning: FAQs
1. What is a Pivot Point in trading?
A Pivot Point is a technical analysis reference level calculated using the previous period’s high, low, and closing prices. Traders use it to identify potential support, resistance and areas to monitor during the current trading session.
2. How are Pivot Points calculated?
The standard Pivot Point is calculated using:
PP = (H + L + C) / 3
Support and resistance levels are then calculated using the Pivot Point and the previous period’s high and low.
3. What is the formula for Pivot Point?
The standard formula is:
PP = (H + L + C) / 3
The commonly used levels are:
S1 = (2 × PP) – H
S2 = PP – (H – L)
R1 = (2 × PP) – L
R2 = PP + (H – L)
4. How do traders use Pivot Points?
Traders use Pivot Points as reference levels for analysing potential support, resistance, breakouts and reversals. They may combine them with price action, volume and other technical indicators.
5. When should you buy using Pivot Points?
There is no single buy signal based only on a Pivot Point.
A trader may study a bounce from support, a breakout above resistance or a recovery above the central Pivot Point, along with other confirmation and risk-management factors.

Blog by Aliceblue News Desk
The Alice Blue Team is a passionate group of analysts delivering expert market insights, comprehensive coverage of stocks, economy, commodities, and personal finance through clear, actionable research.