
How to Track Institutional Buying in Stocks
Blog by Aliceblue News Desk
01 September 2026
12 minutes

Quick Definition
Institutional buying refers to large-scale stock purchases made by Foreign Institutional Investors and Domestic Institutional Investors – mutual funds, insurance companies like LIC, pension funds, and foreign portfolio investors. These transactions signal substantial institutional confidence and often precede sustained price moves that retail buying alone cannot sustain.
Table of Contents
- What Are FII and DII Investments?
- Why Institutional Buying Matters
- How to Identify Institutional Buying in Stocks
- Where to Track Institutional Buying in Indian Stocks
- Example of Institutional Buying in a Stock
- Key Signs of Institutional Accumulation
- Institutional Buying vs Retail Buying
- Why Track Institutional Buying?
- Limitations of Tracking Institutional Buying
- Practical Tips for Tracking Institutional Buying
- Common Mistakes When Tracking Institutional Buying
- Who Can Use Institutional Buying Data?
- Frequently Asked Questions
- Conclusion
What Are FII and DII Investments?
FIIs – Foreign Institutional Investors, also called FPIs or Foreign Portfolio Investors – are overseas entities investing in Indian equity markets. Global asset managers, sovereign wealth funds, hedge funds, and foreign pension funds all fall into this category. Their flows are sensitive to global risk appetite, currency dynamics, and India-specific macro factors.
DIIs – Domestic Institutional Investors – include Indian mutual funds, insurance companies, and pension funds like EPFO. They represent domestic capital and often act as a counterbalancing force to FII flows – buying when foreign money exits during global risk-off episodes, and sometimes selling when foreign money floods back in.
Both groups matter. When they’re both buying simultaneously, the combined weight of that capital tends to produce particularly strong and sustained price movements.
For a closer look at how foreign and domestic institutions influence Indian markets, see our guide to FII and DII activity.
Why Institutional Buying Matters
- Institutions manage thousands of crores. Before deploying that capital into any single stock, they conduct research that retail investors simply can’t access – management meetings, factory visits, channel checks with distributors, forensic accounting reviews. When they conclude that a stock is worth buying at a specific price range, that conclusion is based on information depth that most retail investors never get close to.
- The other factor is mechanics. An institution buying ₹500 crore worth of a mid-cap stock can’t do it in a single day without moving the price dramatically against itself. So they accumulate over weeks or months, buying in controlled quantities within a target price range. This creates a pattern – volume picking up, delivery percentages staying elevated, price holding within a range – that shows up in exchange data before the stock breaks out.
If the stock eventually moves out of its consolidation range, understanding breakout trading can help investors evaluate the price and volume confirmation behind the move.
How to Identify Institutional Buying in Stocks
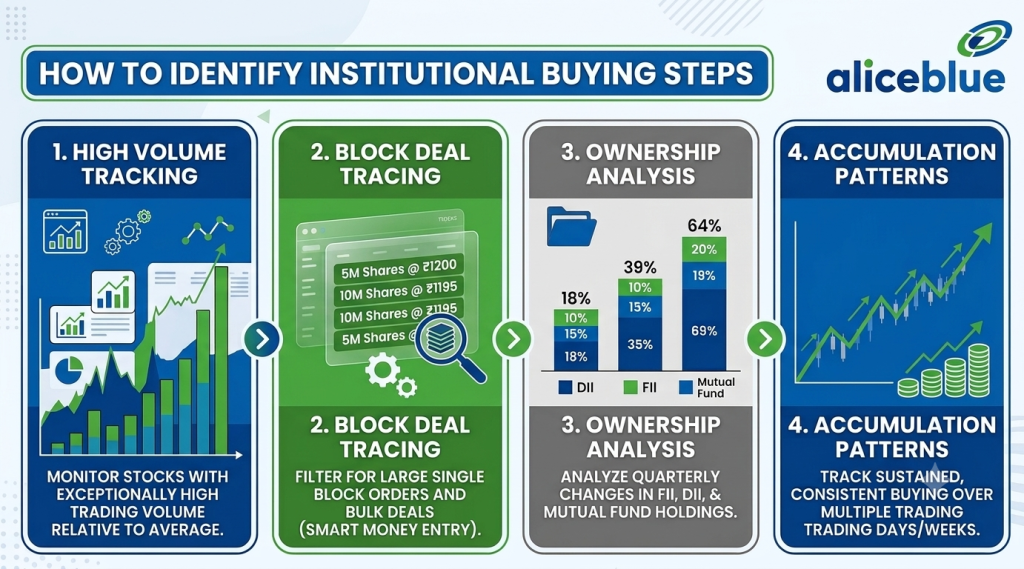
Step 1: Monitor Delivery Percentage Alongside Volume
High volume alone doesn’t mean institutional buying. Intraday traders can generate enormous volume without ever taking delivery of shares. What matters is the combination: a volume spike of 3x to 5x the 20-day average, paired with a delivery percentage above 55 to 65%.
High delivery percentage means participants are taking shares into their demat accounts – not squaring off intraday positions. That’s the institutional fingerprint. When you see volume surge and delivery stay consistently above 60%, actual ownership is changing hands in meaningful quantity.
To put a volume spike into context, it also helps to understand how trading volume works and what it can indicate about market activity.
Step 2: Check Bulk and Block Deal Reports
NSE and BSE publish bulk deal and block deal reports daily after market close. These are mandatory disclosures, and they’re publicly accessible.
Bulk deals occur when a single entity buys or sells more than 0.5% of a company’s total listed shares in a single day during regular trading hours. Block deals are single transactions worth a minimum of ₹25 crore, executed in dedicated 15-minute windows at the session open or close, with compulsory delivery settlement. Look for the buyer’s name – specifically for recognised fund houses, AMCs, and foreign institutional names. Repeated net buys by the same institution across consecutive sessions are a particularly strong signal.
Feature | Bulk Deal | Block Deal |
Meaning | Large transaction crossing the applicable disclosure threshold | Large transaction executed through the block-deal mechanism |
Where reported | Exchange disclosures | Exchange disclosures |
Timing | Regular market trading | Designated block-deal window |
What investors can learn | Buyer/seller and transaction details | Buyer/seller and transaction details |
Does it confirm accumulation? | No | No |
Step 3: Track Quarterly Shareholding Patterns
SEBI mandates that listed companies disclose their shareholding patterns within 21 days of each quarter’s end. This data is published on NSE and BSE portals and aggregated on platforms like Screener.in and Trendlyne.
What you’re looking for is consecutive quarter-on-quarter increases in FII or DII holding percentages. A single quarter increase could be coincidental. FII holding rising from 3% to 5.5% over two consecutive quarters, while DII holding also increases, is a meaningful pattern suggesting sustained accumulation rather than tactical positioning.
Step 4: Track Daily FII and DII Buying and Selling
NSE and BSE publish daily provisional cash market trading figures for FIIs and DIIs – typically around 6:30 PM IST. When both FIIs and DIIs show net buying positions across multiple consecutive trading sessions, institutional momentum is active and directional. One day means little. Five consecutive days of net buying from both categories means something.
Where to Track Institutional Buying in Indian Stocks:
Data | Where to check | Frequency |
FII/FPI and DII activity | NSE/BSE | Daily |
Bulk deals | NSE/BSE | Daily |
Block deals | NSE/BSE | Daily |
Shareholding pattern | NSE/BSE/company filings | Quarterly |
Mutual fund holdings | Fund disclosures | Periodic |
Stock fundamentals | Company filings | Periodic |
Example of Institutional Buying in a Stock
XYZ Electrics Ltd., a hypothetical mid-cap company, has been consolidating in a ₹200 to ₹210 price range for two months. Then, on a Tuesday, it moves to ₹218 on 4x its average daily volume.
Checking the NSE delivery report reveals a 68% delivery percentage – well above normal for this stock. That evening, NSE publishes a block deal disclosure showing a major domestic mutual fund bought 15 lakh shares at ₹212.
Two quarters later, the company’s quarterly filing shows DII holding increased from 4.2% to 8.7%. The stock, over the following months, moves from ₹218 to ₹310.
The delivery data and block deal disclosure were visible before the breakout. The shareholding change confirmed the accumulation in the quarterly filing. Retail traders who saw the early signals had entry opportunities well before the full move played out.
Key Signs of Institutional Accumulation
- Gradual price action within a tight range: institutions build positions carefully to avoid raising their average purchase cost. A stock that holds within a 5 to 8% range for several weeks while volume steadily increases is a classic accumulation pattern.
Understanding support and resistance levels can help investors assess whether this type of price consolidation is occurring near an important price zone. - Volume-delivery alignment: high trading volume on green days paired with delivery percentages consistently above 55 to 60%. The delivery figure is what separates institutional accumulation from intraday speculation.
- Regulatory footprints: bulk and block deal disclosures are mandatory. Recurring names from recognised institutions across multiple deal disclosures in the same stock are a clear signal.
- Long-term holding horizon: institutional positions don’t turn over weekly. Once established, they tend to create sustained price support during broader market corrections, which is why stocks with strong institutional backing often recover faster from dips than retail-dominated names.
Institutional Buying vs Retail Buying
Parameter | Institutional Accumulation | Retail Buying |
Trade Execution | Spread across days or weeks | Executed instantly in a single order |
Research Foundation | In-depth financial analysis and field checks | News, social media, or short-term tips |
Volume Impact | High volume with heavy delivery (above 55%) | Moderate volume with lower delivery |
Investment Horizon | Medium to long term – 1 to 5 years | Short-term or intraday focused |
Capital Scale | Multi-crore order sizes | Small to moderate positions |
Why Track Institutional Buying?
- Riding genuine capital momentum is the primary benefit. When you enter in the same direction as institutional money, the underlying force sustaining the price trend is far more durable than retail enthusiasm alone. Institutions don’t panic-sell on a bad news day – they tend to hold, and their holding provides a floor.
- The quality filter is valuable too. Major mutual funds and foreign institutional investors don’t put significant capital into companies with questionable governance or weak fundamentals. High and increasing institutional ownership is often a proxy for business quality that has survived the scrutiny of professional research teams.
Institutional ownership is only one part of the picture, so investors should also use fundamental analysis to assess a company’s financial health, valuation and business prospects.
Limitations of Tracking Institutional Buying
- Quarterly data lags significantly. By the time shareholding disclosures confirm institutional accumulation, the stock has often already moved. The bulk and block deal data is daily and more actionable – but even that reflects yesterday, not today.
- Not all bulk deals are directional buys. High-frequency and proprietary trading desks execute buy-sell pairs on the same day for arbitrage. These show up in the bulk deal data but represent no net new ownership. Always verify whether the deal was a net long position by a genuine buy-and-hold institution.
- Selling Can Also Produce High Volume and Delivery. Institutions sell gradually during market tops, creating high volume with elevated delivery percentages – the same surface-level pattern as buying. Checking whether the price trend is rising or falling alongside the volume, and tracking the direction of shareholding changes in subsequent quarterly filings, is what separates the two scenarios.
Practical Tips for Tracking Institutional Buying
- Set the delivery threshold before acting on any volume signal. Treat volume surges as institutional only if delivery exceeds 50 to 60%. Below that, assume intraday speculation until proven otherwise.
- Verify buyer names in bulk deal disclosures. A recognised AMC, a named foreign portfolio investor, or an insurance company buying is meaningfully different from an unrecognised entity. The name is disclosed – check it.
- Use Screener.in to automate the quarterly holding change filter. Set up a custom query highlighting companies where institutional holding – FII plus DII combined – increased by more than 1 percentage point quarter on quarter. This filters the universe to names showing active accumulation without manual review of every company’s filing.
- Always maintain a stop-loss. Institutional backing reduces risk on a probabilistic basis – it doesn’t eliminate it. Institutions get the thesis wrong. They exit positions. Market-wide events override individual stock dynamics. Risk management applies regardless of who else is in the trade.
A clear stop-loss strategy can help manage downside risk when an institutional-buying thesis does not play out as expected.
Common Mistakes When Tracking Institutional Buying
- Treating every bulk deal as a buy signal ignores the arbitrage reality. Check the buyer identity, check whether it was net buying or part of a paired trade, and verify whether the same entity appears again in subsequent sessions. A one-time, unrecognised buyer in a bulk deal proves nothing.
- Buying overvalued stocks because FIIs are buying produces poor risk-reward outcomes. Institutional presence validates research quality and management credibility. It doesn’t override valuation math. A stock trading at 60x earnings with institutional backing still has 60x earnings risk if growth disappoints.
- Confusing high intraday volume with institutional accumulation is perhaps the most common error. Volume without delivery is noise. The delivery percentage is the filter that separates genuine ownership transfer from intraday speculation. Never skip it.
Who Can Use Institutional Buying Data?
- Swing traders identifying breakout candidates benefit from the delivery and volume data as a real-time signal of when institutional money is starting to move into a stock – often weeks before the price breakout becomes obvious.
- Positional investors holding for weeks to months use institutional flow data to validate that the momentum behind a position is durable and backed by capital that won’t evaporate on a single bad day.
- Long-term investors use the quarterly shareholding pattern as a quality screen – checking whether recognised institutions are steadily building positions over multiple quarters. Consistent accumulation over 3 to 4 quarters is one of the more reliable indicators of business quality surviving professional scrutiny.
Conclusion
Tracking institutional buying isn’t about following the herd – it’s about identifying where deep research and substantial capital are being deployed before the broader market prices in the implications. The signals are public, mandatory, and available for free on exchange portals. Delivery percentages, bulk and block deal disclosures, daily FII/DII flows, and quarterly shareholding changes together form a coherent picture of where smart capital is moving.
That picture doesn’t replace your own analysis. But it provides a powerful filter for focusing research attention on the right names – the ones where institutional conviction is building, not fading.
Frequently Asked Questions
Daily net buying and selling figures are published every evening after market close – typically around 6:30 PM IST – on the official NSE and BSE websites under the market data section. Both provisional and final figures are available.
A delivery percentage consistently above 50 to 60% alongside a 3x to 5x volume spike generally signals institutional accumulation. Below 50%, the volume is more likely to reflect intraday trading activity.
No. Verify whether the deal was a net buy by a recognised institution, not an intraday arbitrage paired trade. Check the buyer identity disclosed in the filing and see whether the same entity appears across multiple sessions.
Quarterly shareholding patterns are available in the corporate filings section of NSE and BSE portals. Screener.in and Trendlyne aggregate this data in more readable formats and allow filtering for specific holding change thresholds.
Three weeks to several months is the typical range. Institutions buy in controlled batches within a target price range to keep average acquisition costs low. The accumulation phase often ends with a price breakout once sufficient supply has been absorbed.
Bulk deals involve transactions exceeding 0.5% of a company’s total listed shares and occur during regular trading hours. Block deals are single transactions worth at least ₹25 crore, executed in dedicated 15-minute windows at the session open or in the afternoon, with compulsory delivery settlement.
This is common – different institutions operate on different strategic horizons and respond to different triggers. Focus on combined net institutional ownership direction. If total FII plus DII holding grows quarter over quarter despite one group selling, the net institutional bias remains positive.
SEBI mandates that listed companies submit updated shareholding patterns within 21 days of each fiscal quarter’s end – Q1 by July, Q2 by October, Q3 by January, Q4 by April.
Screener.in for custom queries on quarterly institutional holding changes. NSE and BSE portals for daily bulk and block deal reports. Trendlyne for tracking monthly mutual fund portfolio additions and institutional activity timelines across individual stocks.
This is often a strong contrarian signal. If institutions are increasing holdings while price falls, they’re either adding to positions at lower prices – strengthening the thesis – or the market is temporarily mispricing what institutions believe is a quality business. Verify the accumulation is coming from recognised long-term institutions, not arbitrage or short-term players, before drawing conclusions.

Blog by Aliceblue News Desk


