
How to Use Bollinger Bands for Stock Trading in India
Blog by Aliceblue News Desk
19 August 2026
10 minutes
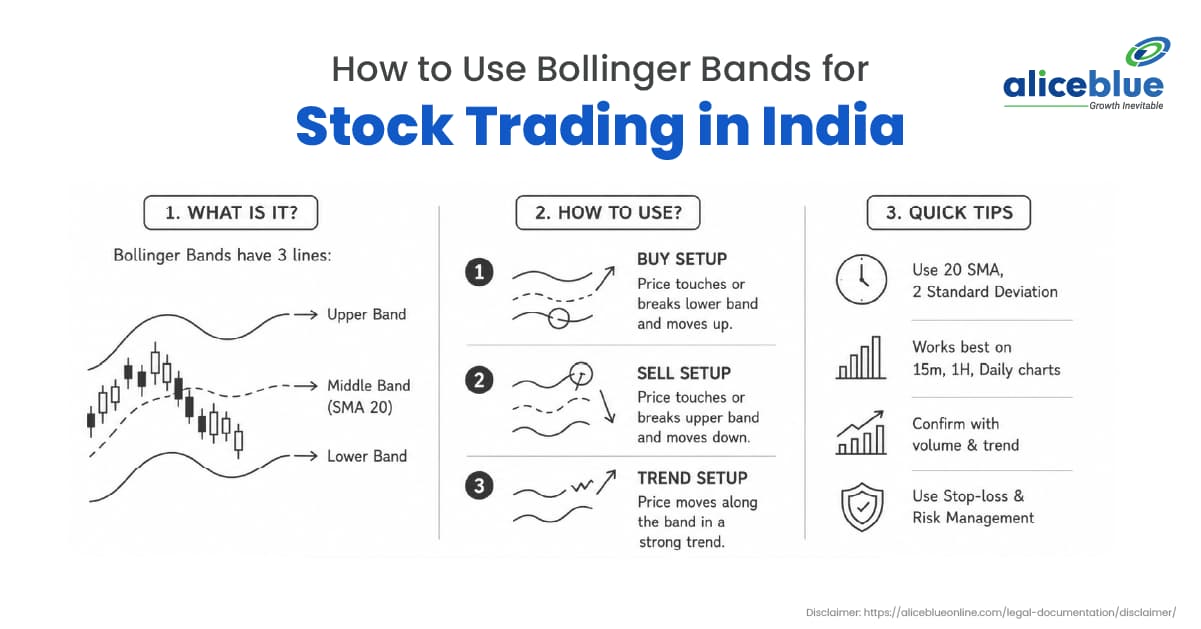
Quick Definition
Bollinger Bands are a technical analysis indicator consisting of a middle Simple Moving Average (SMA) and two outer bands that expand or contract based on stock price volatility. Traders use them to identify dynamic support and resistance, potential price breakouts, and overbought or oversold conditions on stock charts.
In this guide, you will learn how to use Bollinger Bands for stock trading in India, how the indicator works step-by-step, actionable trading strategies, and critical risk management rules for Indian markets.
What are Bollinger Bands?
Developed by technical analyst John Bollinger, Bollinger Bands are a visual tool used to measure market volatility and price levels relative to an average over time.
The indicator is composed of three primary lines plotted directly onto a price chart:
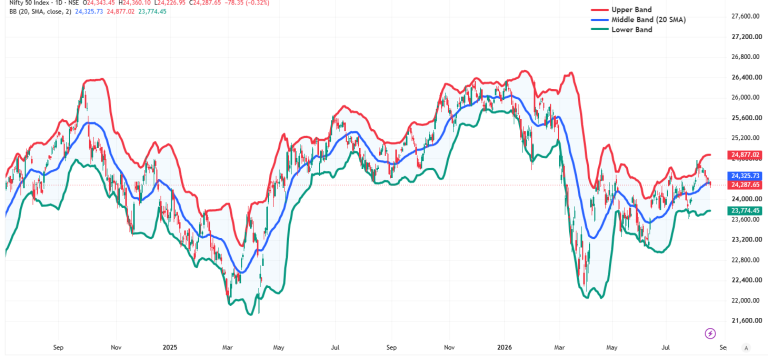
- Middle Band: A standard 20-period Simple Moving Average that tracks the average closing price of a stock over the last 20 periods.
- Upper Band: Plotted two standard deviations above the middle band.
- Lower Band: Plotted two standard deviations below the middle band.
A standard deviation is simply a statistical calculation that measures how far price values fluctuate from their average. When a stock becomes highly volatile (such as during quarterly earnings or major policy updates), the standard deviation rises, causing the upper and lower bands to widen. When price fluctuations settle into a narrow range, the standard deviation falls, causing the bands to contract.
How Bollinger Bands Work
Bollinger Bands function as a dynamic boundary for price action. Under a normal statistical distribution, approximately 95% of all price action occurs inside the outer bands.
Here is how the indicator operates in practice across different market phases, in live Nifty 50 Chart (from period of June 2025 to Aug 17, 2026):
Step 1: Identifying Market Volatility (The Squeeze vs. Expansion)
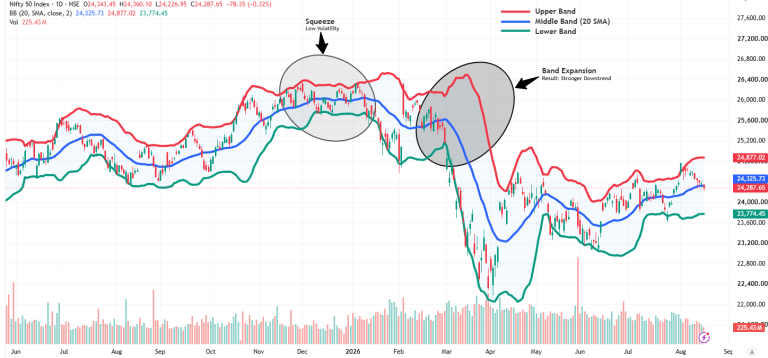
- The Squeeze: When the upper and lower bands contract tightly toward the 20 SMA, it indicates exceptionally low market volatility. Low volatility is almost always followed by high volatility, signalling an impending price breakout.
- Band Expansion: When the bands fan outwards rapidly, it signals a surge in market volatility and the start of a strong trend.
Step 2: Observing Price Behaviour Relative to Bands
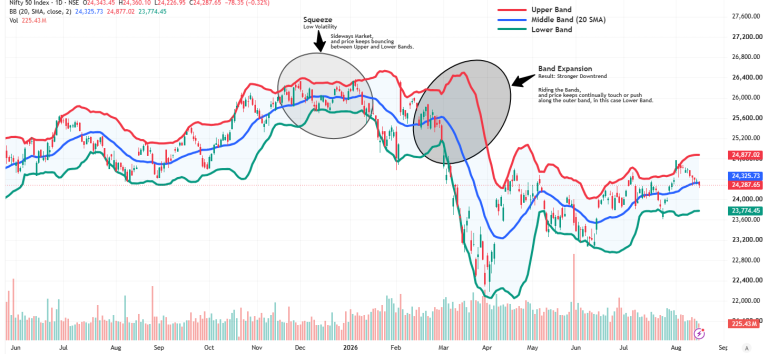
- Mean Reversion: In a sideways or range-bound market, price tends to bounce between the lower band and upper band, treating the middle band (20 SMA) as an equilibrium point.
- Riding the Bands: In a strong trend, price will continually touch or push along an outer band. In an uptrend, prices “walk up” the upper band; in a downtrend, prices “walk down” the lower band.
Step 3: Executing Trades with Confirmation
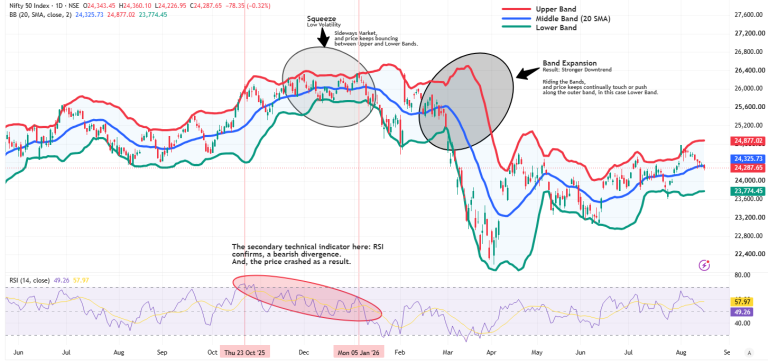
Traders use price action signals (such as candlestick reversal patterns) or secondary technical indicators (like RSI or Volume) at the band boundaries to confirm whether a stock will break out or bounce back toward the average.
Example of a Bollinger Bands Trade
To see how a Bollinger Bands trading strategy works in a practical scenario, consider an intraday setup on an Indian large-cap stock like Reliance Industries on a 15-minute chart.
- Stock: Reliance Industries (NSE)
- Timeframe: 15-Minute Intraday Chart
- Indicator Setting: Bollinger Bands (20, 2)
Setup: Stock consolidates in a tight 40-minute squeeze near ₹2,980.
Breakout Trigger: A bullish candle closes above the Upper Band at ₹3,000 with trading volume 35% higher than the 10-period average.
Entry Price: ₹3,002 (at the open of the subsequent candle)
Stop-Loss: ₹2,980 (placed at the Middle Band / 20 SMA)
Risk Per Share: ₹22
Target Price: ₹3,046 (maintaining a 1:2 Risk-to-Reward ratio)
Result: Target hit within 45 minutes as volatility expanded.
Key Features of Bollinger Bands
- Dynamic Volatility Tracking: Unlike fixed support lines, the outer bands continuously widen and narrow according to actual market activity.
- Built-in Mean Reversion: The middle band acts as an ongoing baseline; prices that deviate excessively often return toward this 20 SMA centre line.
- Multi-Timeframe Application: Works effectively across multiple charting timeframes, including 5-minute charts for intraday trading and daily charts for swing trading.
- Statistical Boundaries: Designed to capture roughly 95% of historical price points between the outer bounds, making price closes outside the bands statistically significant.
Advantages of Using Bollinger Bands
- Clear Volatility Visualisation: Traders can instantly judge whether a market is quiet or hyper-volatile by checking the width of the bands.
- Objective Entry and Exit Rules: Provides clear reference zones for placing stop-losses (e.g., at the middle band) and setting profit targets.
- High-Probability Breakout Detection: The “Bollinger Band Squeeze” gives traders early warning of major price expansions before they occur.
- Versatile Indicator Pairings: Pairs smoothly with momentum indicators like RSI, MACD, or Volume to eliminate false trading signals.
Risks and Limitations
- Lagging Nature: Because Bollinger Bands are calculated using a 20-period simple moving average, they reflect past price data and do not predict future moves automatically.
- The “Band Walk” Trap: Touching the upper band does not automatically mean a stock is overbought and should be sold. In strong rallies, price can continue hugging the upper band for days, leading to heavy losses for traders who try to short the stock.
- False Breakouts: During low-volume market hours, price may temporarily pierce an outer band before quickly reversing back into the range.
Tips for Beginners
- Stick to Default Settings: Start with the standard setting of 20 periods and 2 standard deviations on platforms like Alice Blue or TradingView.
- Always Use Stop-Loss Orders: Place your stop-loss order near the middle band or recent swing low to protect your capital against sharp reversals.
- Confirm with Volume: Only trade a band breakout if trading volume on the NSE/BSE is significantly higher than average.
- Practice Risk Management: Never risk more than 1% to 2% of your total trading capital on a single setup.
Bollinger Bands vs. Simple Moving Average (SMA)
Comparing Bollinger Bands to a standard Simple Moving Average highlights why adding volatility bands improves decision-making:
Feature | Simple Moving Average (SMA) | Bollinger Bands |
Primary Function | Tracks average price direction | Tracks average price and volatility |
Visual Structure | Single line tracking trend | Three lines creating a dynamic channel |
Volatility Context | None | High (widening bands) or Low (narrowing bands) |
Breakout Detection | Weak (shows average cross only) | Strong (detects volatility squeezes) |
Best Used For | Basic trend identification | Volatility timing, mean reversion, and breakouts |
Common Mistakes to Avoid
- Trading Bands in Isolation: Buying automatically whenever price touches the lower band without waiting for candlestick confirmation or volume support.
- Ignoring Macro Events: Trading technical squeezes right before major events like the RBI Monetary Policy decision, Union Budget updates, or quarterly result announcements.
- Constantly Altering Settings: Adjusting indicator periods after every losing trade instead of keeping parameters consistent over a larger sample size.
- Over-leveraging Index Options: Buying short-dated Nifty/Bank Nifty options during a flat market phase where time decay (Theta) quickly destroys option values.
Who Should Use Bollinger Bands?
- Intraday Equity Traders: To spot quick volatility expansion moves during early trading hours on liquid NSE stocks.
- Index & F&O Traders: To trade breakout setups on Nifty 50 and Bank Nifty contracts when volatility spikes.
- Swing Traders: To catch high-probability entry points when quality mid-cap or large-cap stocks bounce off the lower band or pull back to the 20 SMA during an uptrend.
Conclusion
Bollinger Bands are one of the most effective technical indicators available to stock traders in India. By giving you a clear view of market volatility, this tool helps you distinguish between sideways consolidation and explosive trend breakouts.
To trade successfully, avoid treating the outer bands as rigid buy or sell triggers. Instead, use them as dynamic reference zones combined with price action patterns, volume, and disciplined risk management.
Bonus: If you enjoyed this blog and found it valuable, check out “7 Best Indicators for Swing Trading,” written by the same author.
Frequently Asked Questions
The standard setting of 20 periods and 2 standard deviations (20, 2) on a 5-minute or 15-minute candlestick chart works best for intraday trading on NSE stocks and indices like Nifty 50.
No. Touching the upper band simply means the price is relatively high compared to its 20-period average. In strong bull trends, stock prices can continually push along the upper band for extended periods.
A popular combination strategy is looking for confluence: buy when price touches or pierces the lower Bollinger Band while the 14-period RSI drops below 30 (oversold condition), backed by a bullish reversal candlestick pattern.
Yes. Options buyers frequently look for a “Bollinger Band Squeeze” on 3-minute or 5-minute index charts. When the squeeze breaks with strong volume, option premiums often expand rapidly as Implied Volatility (IV) increases.
You can use stock screening platforms like Chartink or TradingView India by building a filter for the BandWidth Indicator, and look for stocks where the BandWidth value drops to a multi-week low (typically below 3% to 5%). This instantly filters out consolidated stocks that are preparing for an explosive breakout.
Overnight news or global market moves often cause Indian stocks to open with a significant gap. A large gap causes the bands to instantly expand, which can distort standard deviation metrics on lower timeframes. If a stock gaps open far outside the upper or lower band at 9:15 AM, avoid chasing it immediately. Wait 15 to 30 minutes for price action to settle, as prices frequently pull back toward the 20 SMA middle band to fill the opening gap.
Option buyers benefit most during a squeeze. Low volatility during consolidation keeps Implied Volatility (IV) and option premiums low. Buying calls or puts right as the price breaks out allows option buyers to profit from both directional momentum and IV expansion. Conversely, option sellers prefer wide, expanding bands or range-bound markets where option premiums are higher and time decay works in their favour.
Multi-timeframe analysis helps filter out false signals. Start on a higher timeframe (such as the Daily or 1-Hour chart) to establish the broader trend by checking whether prices are holding above or below the 20 SMA middle band. Once the direction is confirmed, zoom in to a lower timeframe (such as 5-minute or 15-minute) to execute trades exclusively in the direction of that higher-timeframe trend.
No. Bollinger Bands rely on standard deviation math, which requires liquid, continuous price distribution. Low-volume or illiquid penny stocks often experience irregular trading gaps and upper/lower circuit limits. This distorts standard deviation calculations, rendering the outer bands unreliable and prone to severe false signals.

Blog by Aliceblue News Desk


