
MACD Indicator Explained (2026): Best Settings & Strategies for Indian Stock Trading
Blog by Aliceblue News Desk
23 April 2026
10 minutes
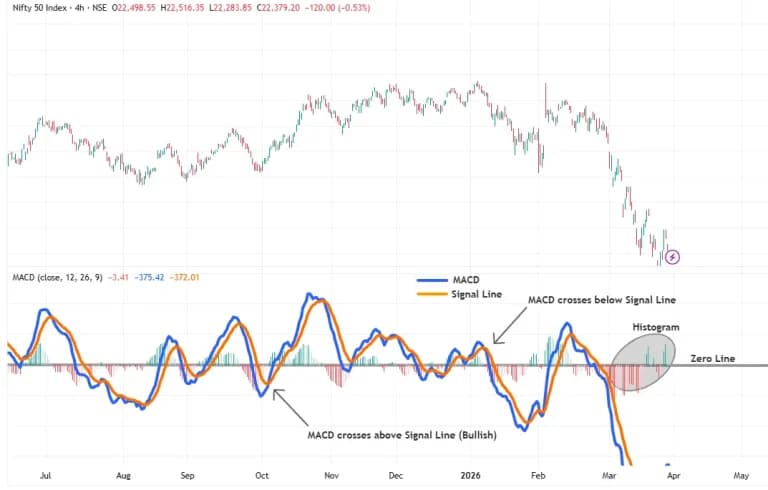
The MACD indicator, short for “Moving Average Convergence Divergence,” is one of the most widely used momentum tools in technical analysis.
Developed in the late 1970s, it remains relevant in 2026 at spotting trend changes, momentum shifts, and entry/exit points in volatile Indian stocks and indices like Nifty 50, Bank Nifty, and Fin Nifty.
Whether you’re a complete beginner frustrated by false signals or an experienced trader looking to sharpen your edge, this complete 2026 guide will show you exactly how to use the MACD indicator for Indian stock trading.
By the end, you’ll have clear, actionable rules, proven settings for intraday and swing trades, and strategies for our market conditions.
What is the MACD indicator in Indian stock trading?
MACD (Moving Average Convergence Divergence) is a momentum indicator that tracks the relationship between two exponential moving averages to identify trend direction, strength, and potential reversals.
Created by Gerald Appel in the late 1970s, the MACD was designed to make it easier to spot changes in the strength, direction, momentum, and duration of a trend without needing complex calculations.
Indian traders love MACD because our markets (Nifty and Bank Nifty) are momentum-driven yet full of sudden reversals due to global cues, FII flows, and budget/news events.
How the MACD Indicator Works (Formula Explained)
The MACD has three main components:
- MACD Line (fast line): shows the difference between a short-term and long-term EMA.
- Signal Line (slow line): a smoothed EMA of the MACD line itself.
- Histogram: visual bars showing the gap between the MACD line and signal line.
- MACD Formula (standard settings):
MACD Line = 12-period EMA − 26-period EMA
Signal Line = 9-period EMA of the MACD Line
Histogram = MACD Line − Signal Line
Example Below (MACD chart on Nifty 50 4h-timeframe at the standard settings):
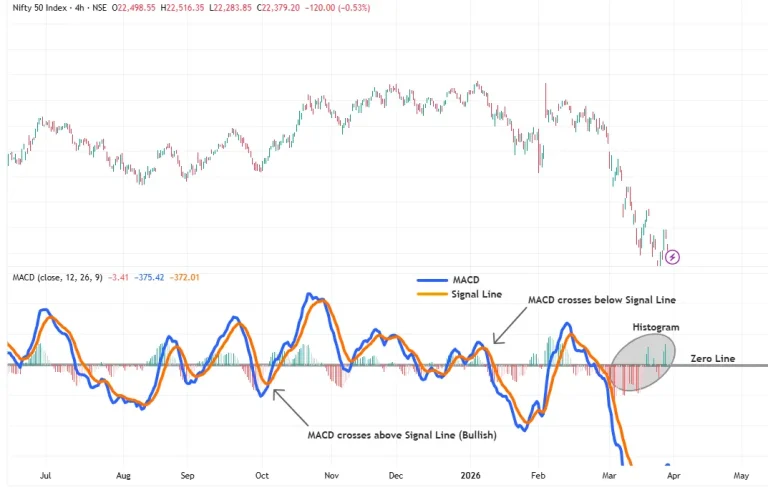
Simply put, when the two moving averages converge (come closer), momentum is slowing. When they diverge (move apart), momentum is strengthening. The histogram makes this instantly visible.
How to Read MACD Signals (4 Powerful Signals)
1. Bullish & Bearish Crossover (Most Popular):
- Bullish Crossover: The MACD Line crosses above the Signal Line → strong buy signal.
- Bearish Crossover: The MACD Line crosses below the Signal Line → strong sell signal.
- Example: Same as above.
2. MACD Divergence Strategy (The “Hidden” Reversal Signal)
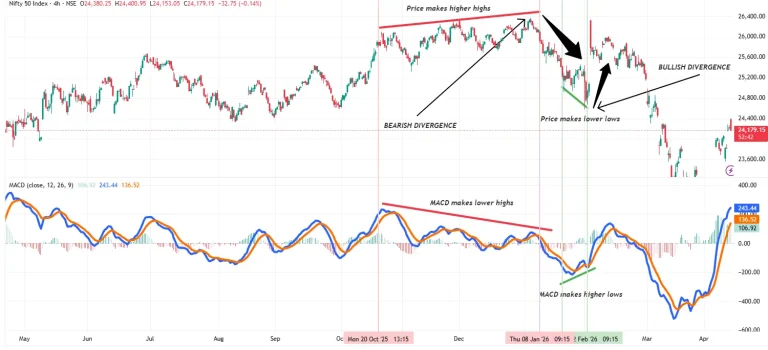
- Bullish Divergence: Price makes lower lows, but MACD makes higher lows → momentum is weakening on the downside → potential reversal up.
- Bearish Divergence: Price makes higher highs, but MACD makes lower highs → momentum fading on the upside → potential reversal down.
- Example:
3. Zero Line Cross Strategy:
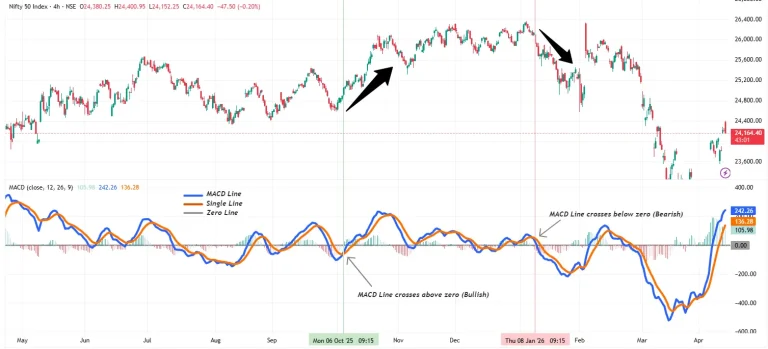
- The MACD line crosses above zero → overall bullish trend.
- The MACD line crosses below zero → overall bearish trend.
- Example:
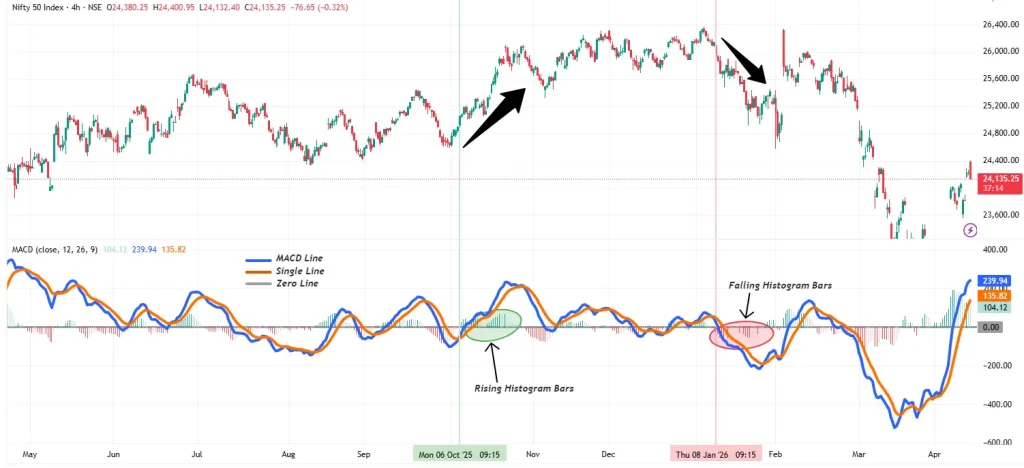
4. MACD Histogram Explained:
- Rising histogram bars (even if small) = increasing momentum.
- Falling histogram bars = weakening momentum.
- Histogram flipping from negative to positive (or vice versa) often confirms crossovers.
- Example:
Tip: Always confirm with price action and volume; never trade MACD alone.
Best MACD Settings for Indian Markets (Intraday & Swing)
The default 12, 26, and 9 work beautifully for most Indian traders, but smart adjustments improve results in our fast-moving market.
Trading Style | Recommended MACD Settings | Best Timeframe | Ideal For | Why It Works in India |
Intraday / Scalping | 5, 13, 6 or 8, 17, 9 | 5-min or 15-min | Bank Nifty, Fin Nifty options | Faster signals in high volatility |
Swing Trading | 12, 26, 9 (default) or 8, 21, 5 | Daily | Reliance, TCS, HDFC Bank | Balances noise and trend capture |
Positional / Long-term | 12, 26, 9 | Weekly | Large-cap stocks, Nifty 50 | Filters out daily noise |
How to choose:
- Volatile days = faster settings.
- Trending markets = default settings.
Step-by-Step: How to Use MACD for Trading in India
- Open your chart on AliceBlue or TradingView.
- Add MACD (default 12, 26, 9).
- Wait for a clear signal (crossover + histogram confirmation).
- Confirm with price action (candlestick pattern) + higher volume.
- Enter the trade with proper risk-reward (minimum 1:2).
- Set stop-loss below the recent swing low (or above the swing high).
- Exit on opposite MACD signal or target hit.
India-specific rule: Never hold intraday positions overnight unless you’re ready for gap risk (common in Nifty after global cues).
5 Powerful MACD Trading Strategies for NSE Traders
- Strategy 1: Pure MACD Crossover + Volume Filter:
Buy when MACD crosses above the signal + volume > 1.5× average. Exit on the opposite crossover.
- Strategy 2: MACD Divergence (High-Probability Reversal):
Look for divergence near support/resistance. Combine with RSI <30 (bullish) or >70 (bearish).
- Strategy 3: MACD + RSI Combo (Very Popular in India):
MACD crossover + RSI crossing 50 = stronger confirmation. Reduces false signals in sideways markets.
- Strategy 4: MACD Histogram + Zero Line Trend Riding:
Stay in the trade as long as the histogram is expanding in the direction of the zero-line cross.
- Strategy 5: MACD + 50/200 EMA (For Bigger Moves):
Only take bullish MACD signals when the price is above the 50 & 200 EMA.
Real-Life MACD Example:
- Nifty 50 Weekly Chart: Zero-line crosses have historically marked major trend shifts (bull runs post-2024 recovery).
Common MACD Mistakes Traders Make in India
- Using MACD alone in sideways/choppy markets → Add RSI or ADX to confirm trend strength.
- Ignoring higher timeframes → Always check the daily signal before taking a 15-minute trade.
- Over-trading every tiny crossover → Wait for histogram confirmation and volume.
- Forgetting risk management → Always use stop-loss; Indian markets have circuit breakers.
- Not adjusting settings for intraday → Default 12, 26, 9 is too slow for 5-min charts.
Pros and Cons of the MACD Indicator
Pros:
- Simple and visual.
- Works across timeframes.
- Excellent for momentum stocks.
- Free on every Indian broker platform.
Cons:
- Lagging indicator (can give late signals).
- Whipsaws in range-bound markets (common in Nifty).
- Not effective alone; always combine with price action/volume.
Conclusion: Is MACD Still Effective in 2026?
The MACD indicator is not magic, but when used correctly with proper risk management, volume confirmation, and India-specific adjustments, it becomes one of the most reliable tools in your trading arsenal.
You now have the complete blueprint, from basics to advanced strategies, real examples, and exact settings that work on NSE/BSE in 2026.
Bonus: If you’re actively trading or testing strategies, using a platform like Alice Blue with integrated TradingView can help you access advanced indicators and multiple timeframes directly within your trading interface.
You can also explore our detailed guide on the best indicators for swing trading to improve your setups.
Frequently Asked Questions
Yes, MACD works on small- and mid-caps, but they tend to be far more volatile and prone to sudden whipsaws than index stocks. Use faster settings (e.g., 8, 17, 9 or 5, 13, 6) on 15-minute or 30-minute charts and apply strict volume filters. Always combine with support/resistance levels, because low-liquidity small-caps can produce many fake crossovers.
Avoid taking fresh MACD trades 30-60 minutes before and after major events. Sudden FII flows and news spikes often create false crossovers and divergences. Wait for the first 15-30 minutes of price action to settle, then look for histogram confirmation on the new trend. This is especially important for Nifty and Bank Nifty, where gap risk is highest.
MACD is purely technical and momentum-based. Use it to time entries and exits in stocks you have already selected through fundamentals (earnings growth, ROE, and sector tailwinds). Many successful Indian traders run a two-step process: fundamental filter first, then MACD + volume for precise entry timing.
Skip the trade. The blog’s “common mistakes” section already stresses checking higher timeframes. A 15-minute bullish crossover is meaningless if the daily chart is still below the zero line or showing bearish divergence. Always trade in the direction of the higher timeframe for higher probability.
- Yes, especially intraday/scalping on Bank Nifty and Fin Nifty options using 5-minute or 15-minute charts with faster settings. On expiry days, however, theta decay and sudden gamma spikes can create extra noise. Use MACD only with strong volume confirmation and tight stops; many traders switch to 3-5 minute charts on expiry Thursdays.
Use TradingView’s replay mode or the strategy tester (available in premium). Apply your exact rules (crossover + volume filter + higher timeframe confirmation); note every trade; and calculate win rate, average risk-reward, and maximum drawdown over the past 2-3 years. Focus on different market regimes, like trending, sideways, and high-volatility periods, to see how the strategy actually performs in Indian conditions.
- MACD is completely free on every major Indian broker platform, like AliceBlue or on TradingView’s free tier. The blog’s bonus mention of AliceBlue simply gives convenient one-click integration and extra timeframes, but you do not need it to use MACD successfully.

Blog by Aliceblue News Desk


