What Is ROE In Share Market?
Blog by Aliceblue News Desk
27 March 2025
10 minutes
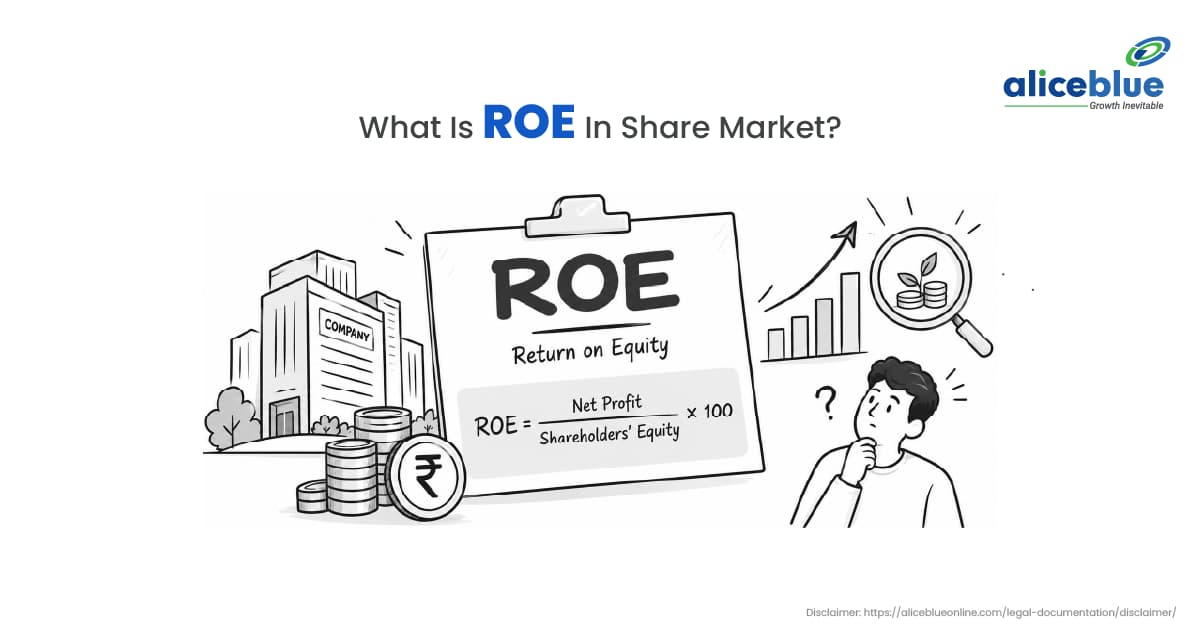
Quick Definition: What Is Return on Equity (ROE)?
Return on Equity is a financial ratio that measures how efficiently a company generates net profit for every rupee of capital invested by its equity shareholders. Expressed as a percentage, it divides net income by shareholders’ equity, producing a single number that cuts through revenue growth and profit headlines to reveal whether management is actually creating wealth.

What Does ROE Mean in the Stock Market?
When you buy shares in a company listed on the NSE or BSE, your investment joins the equity base, the net worth belonging to shareholders- calculated as total assets minus total liabilities. ROE answers what management does with that equity base.
A company earning 25% ROE is generating ₹25 of net profit for every ₹100 of shareholder equity. A company earning 8% ROE is generating ₹8. Both might report impressive absolute profit numbers depending on their size. But the 25% ROE business is allocating your capital far more efficiently, and over time, that efficiency compounds into dramatically different wealth outcomes for long-term shareholders.
The metric connects two standard financial reports. Net Income comes from the Profit and Loss statement: the final Profit After Tax figure after paying all operating expenses, interest, and corporate taxes. Shareholders’ Equity comes from the Balance Sheet: Share Capital plus Reserves and Surplus, or equivalently, Total Assets minus Total Liabilities.
Along with ROE, earnings per share (EPS) helps investors understand how much profit a company generates for each outstanding share.
ROE Formula: How to Calculate Return on Equity
The formula is straightforward. The inputs come from two standard financial statements.
Step 1: Locate Net Income
Find the annual net profit after taxes, interest, and all operating expenses on the Profit and Loss statement.
Step 2: Determine Shareholders’ Equity
From the Balance Sheet: Total Assets minus Total Liabilities equals Shareholders’ Equity. This is the net worth belonging to equity shareholders.
Step 3: Apply the Formula
ROE = (Net Income / Shareholder’s Equity) x 100
Step 4: DuPont Decomposition (Advanced)
For deeper analysis, ROE can be broken into three components that reveal what’s actually driving the number:
ROE = Net Profit Margin x Asset Turnover x Equity Multiplier
This decomposition tells you whether a high ROE is driven by strong margins, efficient asset utilisation, or leverage- three very different stories with different risk implications.
ROE Calculation Example: Step-by-Step
Consider Alpha Engineering Ltd. with these annual figures:
- Net Income (Profit After Tax): ₹200 crore
- Total Assets: ₹1,500 crore
- Total Liabilities: ₹500 crore
Shareholders’ Equity: ₹1,500 crore − ₹500 crore = ₹1,000 crore
ROE: (₹200 crore ÷ ₹1,000 crore) × 100 = 20%
Alpha Engineering generates ₹20 in net profit for every ₹100 of shareholder equity. Whether 20% is good depends on the sector; in a capital-light software business it might be average; in a heavy manufacturing business it would be exceptional. Context always matters.
Key Features of Return on Equity
- Standardised percentage, allows direct comparison across companies of completely different market capitalisations. A ₹500 crore mid-cap IT company and a ₹50,000 crore large-cap IT company can be meaningfully compared on ROE even though their absolute profit figures differ by orders of magnitude.
- Equity-focused denominator measures efficiency specifically for equity shareholders, excluding debt from the denominator. This creates leverage sensitivity that must be carefully managed when interpreting the metric.
- Management quality indicator: a business that consistently earns high ROE over 5 to 10 years is almost certainly doing something structurally right: pricing power, brand strength, operational discipline, or some combination. Sustained high ROE is extremely difficult to fake over a decade.
- Sector-dependent baselines: asset-light businesses like IT services and FMCG naturally earn higher ROE than capital-heavy businesses like infrastructure and power, because they generate profit on a much smaller asset and equity base. The comparison baseline must reflect this reality.
ROE vs ROA vs ROCE: Key Differences
| Metric | Formula | What It Measures | Best Used For |
| ROE, Return on Equity | Net Income ÷ Shareholders’ Equity | Returns on equity capital specifically | Asset-light businesses: IT, FMCG, consumer goods |
| ROA, Return on Assets | Net Income ÷ Total Assets | How efficiently all assets generate profit | Banks, NBFCs, financial institutions |
| ROCE: Return on Capital Employed | EBIT ÷ Total Capital Employed | Efficiency of equity plus debt combined | Debt-heavy sectors, infrastructure, steel, telecom |
For a software company with minimal debt, ROE and ROCE are similar and both meaningful. For an infrastructure business carrying significant debt to fund capital-intensive operations, ROE can look excellent while ROCE reveals mediocre returns on total capital deployed. In debt-heavy sectors, ROCE is the more complete measure. In asset-light sectors, ROE is the more relevant screen.
While ROE focuses on returns generated on shareholders’ equity, Return on Capital Employed (ROCE) helps assess how efficiently a company uses its capital, including debt and equity.
How Investors Use ROE to Analyse Stocks
- Identifying economic moats is where ROE delivers its most powerful signal. Companies that sustain ROE above 18 to 20% for 5 to 10 consecutive years across different market cycles aren’t doing it by accident. They have structural advantages, pricing power, high customer switching costs, proprietary technology, brand equity, or network effects that allow them to earn above-average returns on capital repeatedly. These are the compounders worth owning for the long term.
- Simplifying stock screening across the thousands of NSE and BSE listings becomes manageable when ROE is applied as an early filter. Setting a 5-year average ROE threshold of 15% on a platform like Screener.in immediately reduces the universe from thousands to hundreds, and the companies that survive this filter share a common trait of capital efficiency worth investigating further.
- Evaluating growth quality reveals whether a company is funding its expansion through internal earnings or through repeated equity dilution and borrowing. A company that grows while maintaining or improving ROE is funding growth from profitability, a self-reinforcing cycle. A company that grows while ROE deteriorates is consuming more and more capital for each unit of output, a warning sign.
ROE is one part of fundamental analysis of stocks, which also considers a company’s financial statements, valuation, debt and growth prospects.
Limitations of ROE: What Investors Should Know
- The debt distortion trap is the most important risk in ROE analysis. Since Shareholders’ Equity equals Assets minus Liabilities, taking on more debt reduces the equity denominator. A company can increase its ROE by borrowing more money, without any improvement in operational performance. A business with 30% ROE built on high leverage is a fundamentally different and riskier investment than one with 25% ROE and a clean balance sheet. Always check the Debt-to-Equity ratio alongside any high ROE figure.
- Share buyback inflation creates the same mathematical effect. When a company repurchases its own shares, total equity shrinks. Future ROE rises mechanically without any improvement in the underlying business’s earning power. For mature businesses with genuine excess cash flow, buybacks can be legitimate, but they make ROE appear more impressive than operations might warrant when read in isolation.
- The negative equity false positive is the most technically dangerous trap. If a company has accumulated losses large enough to make total equity negative, dividing negative net income by negative equity produces a mathematically positive ROE. This number is meaningless and misleading. When negative equity exists, discard ROE entirely and use other measures.
- Single-year spikes distort the picture. A one-time asset sale, a tax benefit reversal, or an insurance payout can inflate net income in a specific year without reflecting recurring earning power. Always use 5-year average ROE rather than the most recent single-year figure.
Since borrowing can affect ROE, checking a company’s debt-to-equity ratio can help investors assess whether high returns are accompanied by greater financial leverage.
How to Use ROE When Evaluating Indian Stocks
- Target a 5-year average ROE above 15% as your baseline screen. Not a single exceptional year, sustained performance across at least five years and preferably through at least one market downturn. Consistency reveals structural business quality; a spike reveals an event.
- Pair every high ROE observation with a Debt-to-Equity check. The combination to look for: ROE above 18% alongside D/E below 0.5. This combination- high returns on equity without significant leverage strongly suggests genuine operational superiority rather than financial engineering.
- Compare within sectors. TCS against Infosys is a valid ROE comparison. TCS against NTPC is not. The capital requirements, growth dynamics, and regulatory environments differ so fundamentally that cross-sector ROE comparison produces conclusions that range from useless to actively misleading.
- Consider reinvestment capacity alongside the ROE figure itself. A 35% ROE business is only genuinely valuable if management has productive projects in which to reinvest retained earnings at similarly high rates. If the business is generating exceptional returns but has nowhere to deploy capital, the ROE will eventually compress, and the compounding story breaks down.
Common ROE Analysis Mistakes to Avoid
- Comparing infrastructure or power companies to software companies on ROE and concluding the infrastructure business is “cheap” ignores the structural difference in capital requirements. The IT sector earns higher ROE because it needs almost no physical capital to scale. The infrastructure sector earns lower ROE because it requires massive ongoing capital investment. This is a business model difference, not a quality difference.
- Buying high-ROE stocks without verifying whether the ratio is leverage-inflated has burned many investors who discovered the hard way that debt service capacity, not ROE, determines whether a business survives an economic downturn.
- Assuming compounding is automatic in high-ROE businesses misses the reinvestment question. Compounding only happens when management can find new projects to invest retained earnings at high rates of return. When the industry matures, competition intensifies, or the total addressable market is saturated, ROE compresses and the compounding thesis breaks. Monitor whether ROE is stable, improving, or declining, not just what it is today.

How ROE Fits Into Fundamental Stock Analysis
- Long-term value investors seeking compounders that grow earnings by reinvesting retained profits at high rates will use ROE as a primary quality screen, looking for businesses that have demonstrated above-average capital efficiency across market cycles as evidence of structural competitive advantage.
- Fundamental stock screeners filtering thousands of NSE and BSE listings will use ROE as an early filter before deeper analysis. A 15% or higher 5-year average ROE dramatically narrows the field before any deeper analysis is warranted.
- Quality-at-reasonable-price investors who want strong businesses at fair valuations need ROE to identify the “quality” side of that equation. Paying a premium P/E multiple for a business that earns 8% ROE is rarely justified. Paying the same premium for a business earning 25% ROE consistently is a different conversation entirely.
Conclusion
Return on Equity is one of the most reliable and practically useful metrics available to Indian investors evaluating NSE and BSE listed companies. It cuts through revenue growth headlines and profit size to answer the question that actually matters for long-term wealth creation: is management converting your capital into profit efficiently?
Used correctly, as a 5-year average, paired with debt metrics, benchmarked within sectors, supplemented by DuPont decomposition when the number looks unusually high or low, ROE becomes a powerful filter that separates genuine compounders from capital-intensive businesses that grow without creating proportional value for their equity shareholders.
Frequently Asked Questions
1. What is a good ROE for Indian stocks?
Consistently above 15% over a 3 to 5-year period is a useful starting threshold for most sectors. Companies maintaining 18 to 25% ROE without high leverage over multiple years are typically demonstrating genuine competitive strength. The right benchmark varies by sector, higher in asset-light businesses, lower in capital-intensive industries.
2. Can ROE be negative?
Yes, if a company reports a net loss, net income is negative, producing a negative ROE. When equity is also negative due to accumulated losses, the calculation produces a misleading positive number and should simply be set aside as non-interpretable.
3. Why is ROE sometimes higher than ROCE?
ROE exceeds ROCE when a company is using debt effectively, earning higher returns on borrowed capital than the interest rate it pays on that debt. The financial leverage amplifies equity returns. This is positive when the business is genuinely productive with borrowed capital, and dangerous when debt levels make the business fragile to revenue downturns.
4. Can a company show high ROE and still be a risky investment?
Yes, and this is one of the most important nuances in applying the metric. A company with heavy debt will have a small equity base, producing elevated ROE even if operational performance is mediocre. If debt service becomes unsustainable during a revenue downturn, the business faces serious financial risk despite the impressive historical ROE figure. D/E ratio must accompany every ROE analysis.
5. Why do banks have lower ROE than IT companies?
Banks operate under strict RBI reserve requirements that mandate large capital bases relative to their lending operations. This structural regulatory constraint limits ROE relative to asset-light IT businesses that scale revenue without requiring proportional increases in capital. It’s a business model and regulatory difference, not necessarily a quality difference, which is why banks are better evaluated using ROA and ROE-specific banking sector benchmarks rather than cross-sector comparisons.

Blog by Aliceblue News Desk
The Alice Blue Team is a passionate group of analysts delivering expert market insights, comprehensive coverage of stocks, economy, commodities, and personal finance through clear, actionable research.