What Is The Morning Star And Evening Star Candlestick Pattern?
Blog by Aliceblue News Desk
24 February 2025
9 minutes
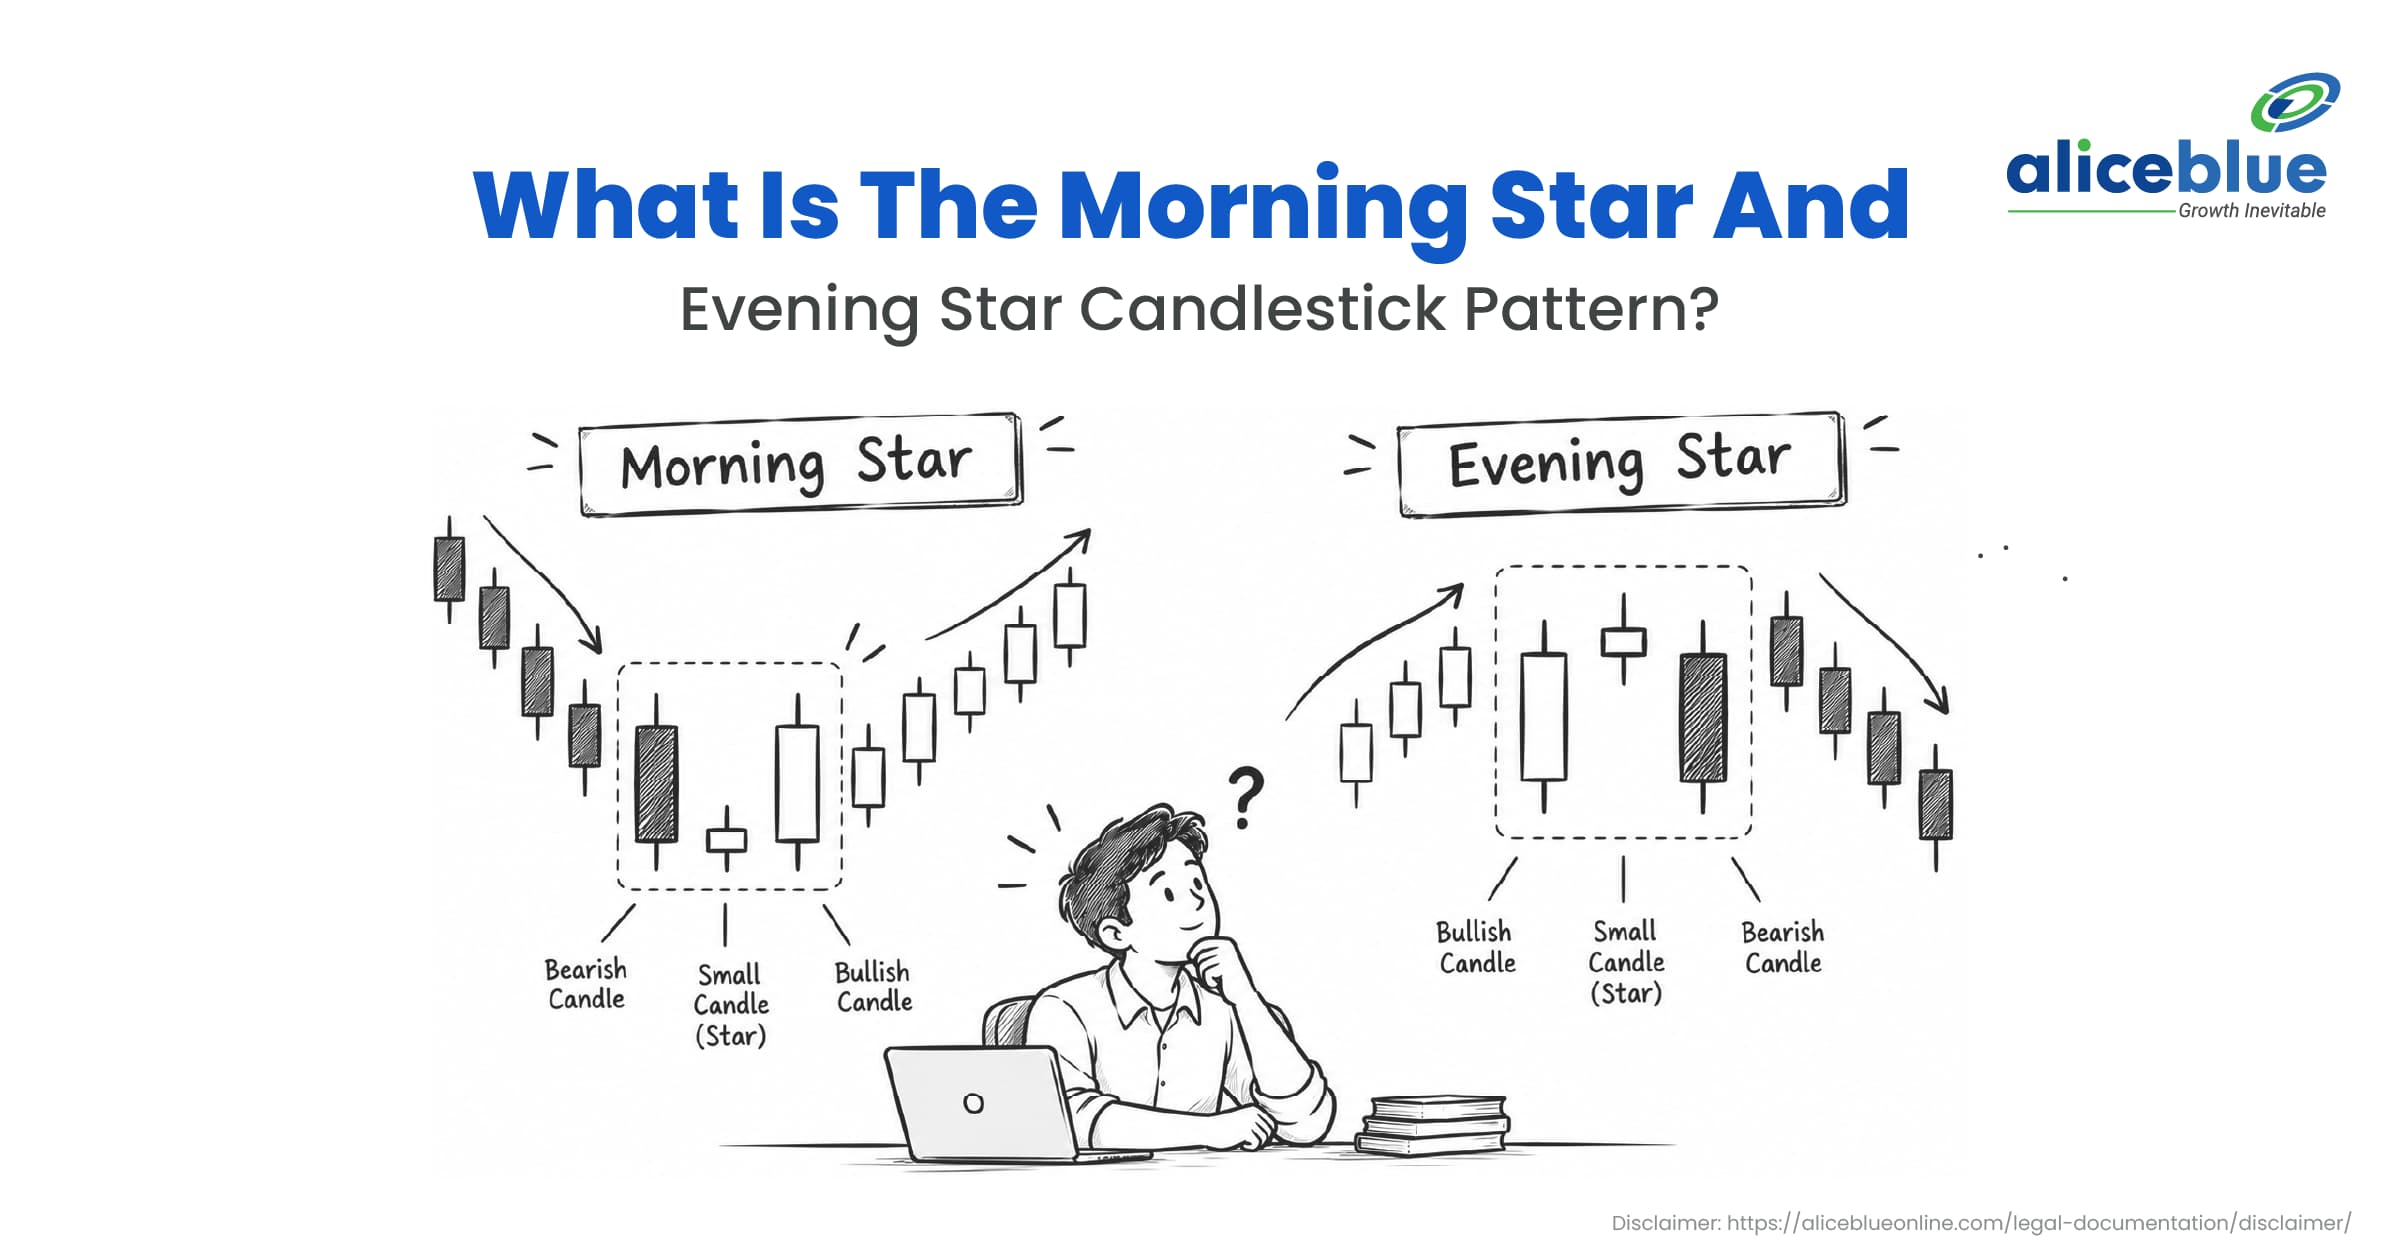
Morning Star and Evening Star are three-candle patterns used in technical analysis to identify possible trend reversals. The Morning Star is a bullish pattern that typically forms after a downtrend, while the Evening Star is a bearish pattern that typically forms after an uptrend.
Quick Definition
- Morning Star: A bullish reversal pattern made up of a bearish candle, a small-bodied candle and a bullish candle. It may signal a shift from selling pressure to buying pressure after a downtrend.
- Evening Star: A bearish reversal pattern made up of a bullish candle, a small-bodied candle and a bearish candle. It may signal a shift from buying pressure to selling pressure after an uptrend.
Table of Contents
- Morning Star Candlestick Pattern Meaning
- How to Identify the Morning Star Pattern
- Evening Star Candlestick Pattern Meaning
- How to Identify the Evening Star Pattern
- Morning Star vs Evening Star
- How to Trade These Candlestick Patterns
- Advantages and Limitations
- Quick Summary
- FAQs

Morning Star Candlestick Pattern Meaning
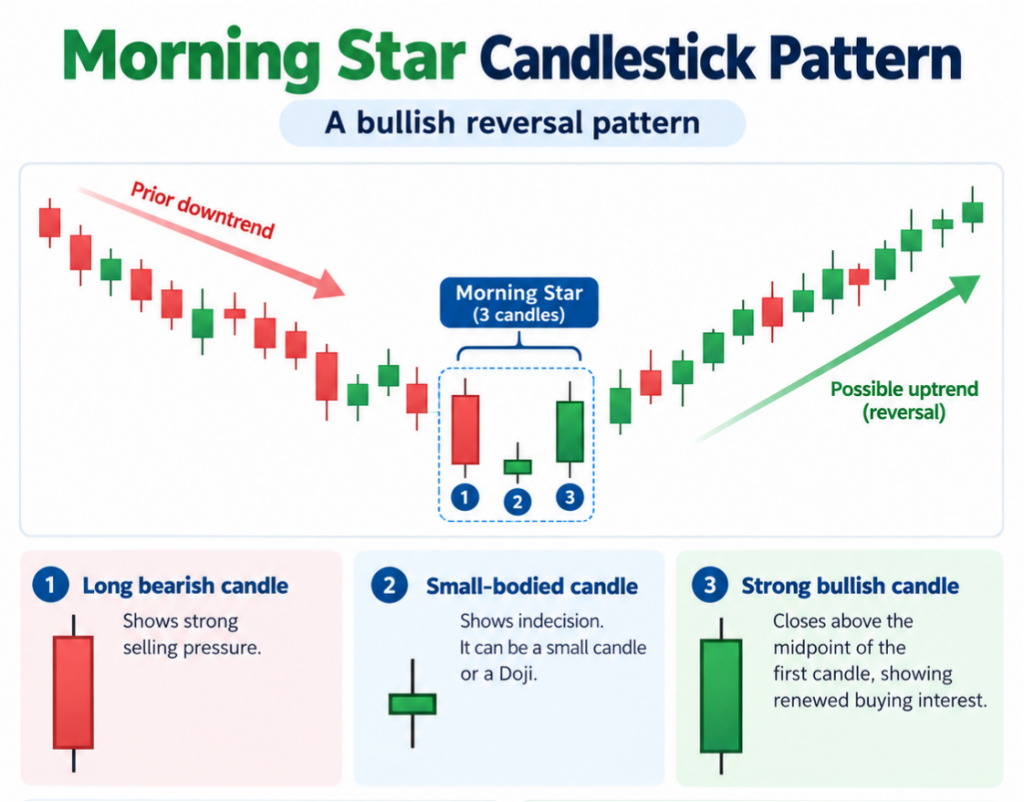
The Morning Star is a bullish reversal pattern that generally appears after a downtrend. It consists of three candles that show a possible change in market sentiment from selling pressure to buying interest.
The three candles are:
- First candle: A long bearish candle that shows selling pressure.
- Second candle: A small-bodied candle, which may be a Doji, indicating indecision between buyers and sellers.
- Third candle: A strong bullish candle that closes well into the body of the first candle, commonly above its midpoint.
The pattern suggests that sellers may be losing control while buyers are becoming more active. However, it does not confirm that the price will rise. Traders often look for additional signs, such as a close above a nearby resistance level or stronger trading volume, before interpreting the pattern as a possible reversal.
How to Identify the Morning Star Candlestick Pattern:
Look for these features when identifying a Morning Star:
- A clear downtrend before the pattern forms.
- A long bearish first candle.
- A small-bodied second candle showing indecision.
- A bullish third candle that closes above the midpoint of the first candle.
A gap between candles may appear in some markets, but it is not necessary for the pattern to form. Gaps are also less common in continuously traded markets.
Morning Star in Uptrends and Downtrends:
The Morning Star is primarily a bullish reversal pattern, so its usual context is a downtrend. Its appearance may suggest that selling pressure is weakening and buyers are stepping in.
If a similar formation appears during an uptrend, it should not automatically be treated as a continuation signal. Traders need to assess the broader trend, nearby support and resistance levels, and subsequent price action.
Morning Star as a Reversal Signal:
The Morning Star may indicate a reversal when it forms after a sustained decline. A bullish third candle shows that buyers have pushed prices higher during that session, but further price action is needed to assess whether the shift will continue.
Traders may look for a close above a nearby resistance level, volume changes or confirmation from other technical tools. No single confirmation method guarantees that the price will continue rising.
Evening Star Candlestick Pattern Meaning
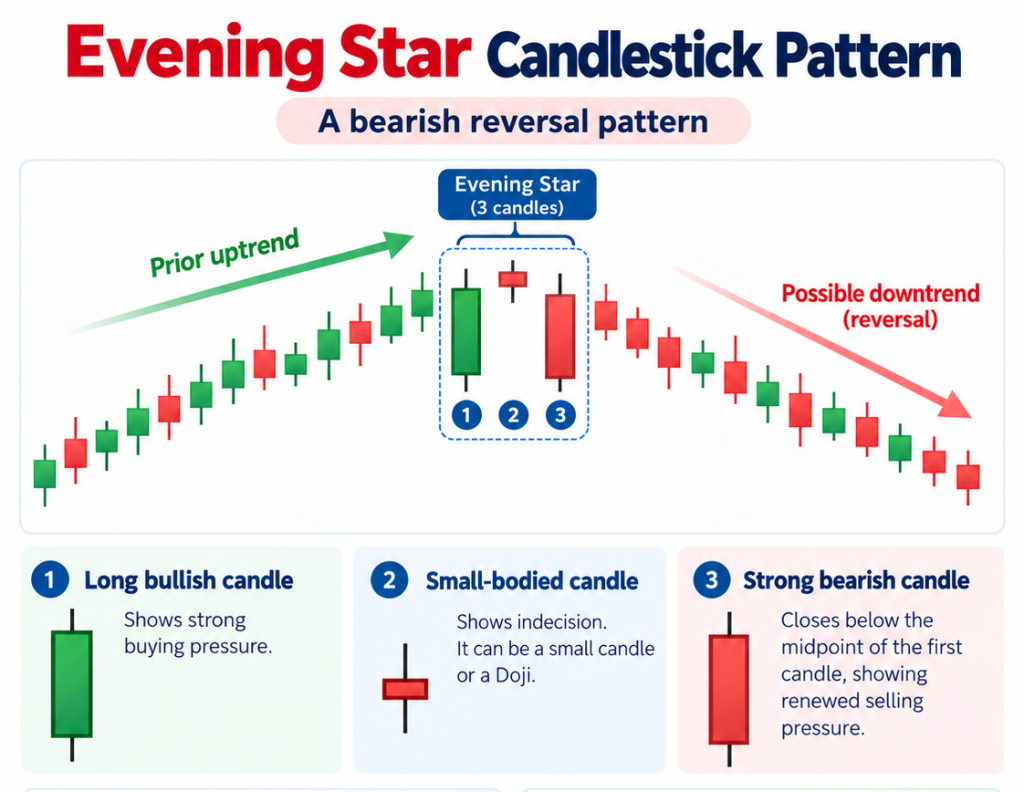
The Evening Star is a bearish reversal pattern that generally appears after an uptrend. It consists of a strong bullish candle, a small-bodied candle and a strong bearish candle.
The three candles are:
- First candle: A long bullish candle that shows buying pressure.
- Second candle: A small-bodied candle, which may be a Doji or spinning top, indicating indecision.
- Third candle: A strong bearish candle that closes well into the body of the first candle, commonly below its midpoint.
The formation suggests that buying momentum may be weakening and selling pressure may be increasing. It is a possible reversal signal, not a guarantee that the market will enter a downtrend.
How to Identify the Evening Star Candlestick Pattern:
Look for these features:
- A clear uptrend before the pattern forms.
- A long bullish first candle.
- A small-bodied second candle showing indecision.
- A bearish third candle that closes below the midpoint of the first candle.
A gap between the first and second candles may appear in some markets, but it is not essential. Traders may also examine volume, nearby resistance levels and subsequent price action when assessing the pattern.
Evening Star in Uptrends and Downtrends:
The Evening Star is primarily a bearish reversal pattern that forms after an uptrend. It may indicate that buyers are losing momentum and sellers are becoming more active.
If a similar formation appears during a downtrend, it should not automatically be considered a continuation signal. Traders should assess the prevailing trend and wait for additional price action before drawing conclusions.
Evening Star as a Reversal Signal:
An Evening Star may warn of a possible shift from an uptrend to a downtrend. The bearish third candle indicates that sellers have pushed prices lower, but the following candles help show whether selling pressure continues.
A move below nearby support, changes in volume or confirmation from other technical tools may provide additional context. These signals can fail, particularly in choppy markets or during strong trends.
Morning Star vs Evening Star Candlestick Pattern
The main difference between the two patterns is their direction and the market conditions in which they typically form.
| Aspect | Morning Star | Evening Star |
| Usual formation | After a downtrend | After an uptrend |
| Signal | Potential bullish reversal | Potential bearish reversal |
| First candle | Long bearish candle | Long bullish candle |
| Second candle | Small-bodied candle | Small-bodied candle |
| Third candle | Strong bullish candle | Strong bearish candle |
| Market sentiment | Buying pressure may be increasing | Selling pressure may be increasing |
| Key level to watch | Support | Resistance |
| Confirmation to consider | Follow-up bullish price action | Follow-up bearish price action |
Neither pattern should be used in isolation. The surrounding trend and subsequent price action matter when interpreting either formation.
How to Trade Morning Star and Evening Star Patterns
Traders may use these patterns as part of a broader technical analysis approach. The steps below explain what to examine; they are not a recommendation to enter a trade.
1. Identify the Existing Trend
Check whether the market has been moving down before a Morning Star or moving up before an Evening Star. The preceding trend is important because both patterns are generally used to identify possible reversals.
2. Check the Three-Candle Formation
Confirm that the candles match the pattern’s structure. A similar-looking formation without the right preceding trend may not carry the same meaning.
3. Look for Confirmation
Traders may examine the next candle, nearby support or resistance, volume and indicators such as RSI or MACD. These tools provide additional context but do not guarantee a successful trade.
4. Plan Risk Before Entering
Decide in advance where the trade idea would no longer be valid, how much you are willing to risk and how you would exit. A candlestick pattern alone does not determine an appropriate stop-loss or profit target.
Advantages of Morning Star and Evening Star Patterns
- Easy-to-recognise structure: Both patterns use three candles, making their basic formation relatively straightforward to learn.
- Potential trend-change signal: They help traders identify situations where buying and selling pressure may be shifting.
- Useful with other tools: They can be assessed alongside support and resistance, volume and technical indicators.
- Applicable across markets: Similar formations can be observed in stocks, currencies and commodities, although their appearance and usefulness vary by market and timeframe.
Limitations of Morning Star and Evening Star Patterns
- False signals: A pattern may form without a lasting change in the trend.
- Need for context: The preceding trend and location on the chart affect how the formation should be interpreted.
- No guaranteed outcome: Confirmation from another candle or indicator cannot eliminate trading risk.
- Market conditions matter: Gaps may be uncommon in continuously traded markets, and short-term price noise can make patterns harder to interpret.
- Not a complete trading plan: The pattern does not determine position size, suitable entry and exit levels, or how much capital to risk.
Morning Star and Evening Star – Quick Summary
The Morning Star is a three-candle pattern that may signal a bullish reversal after a downtrend. The Evening Star is a three-candle pattern that may signal a bearish reversal after an uptrend.
Both patterns show a possible change in buying and selling pressure. Their interpretation depends on the preceding trend, candle structure and subsequent price action. Traders may use support and resistance, volume and technical indicators for additional context, while keeping in mind that neither pattern guarantees a reversal.

Morning Star and Evening Star Candlestick Pattern – FAQs
1. What is a Morning Star candlestick pattern?
A Morning Star is a bullish reversal pattern that usually forms after a downtrend. It consists of a bearish candle, a small-bodied candle and a bullish candle that closes well into the first candle’s body.
2. What does the Morning Star pattern indicate?
It may indicate that selling pressure is weakening and buying interest is increasing. Further price action is needed to assess whether a bullish reversal develops.
accuracy.
3. What is an Evening Star candlestick pattern?
An Evening Star is a bearish reversal pattern that usually forms after an uptrend. It consists of a bullish candle, a small-bodied candle and a bearish candle that closes well into the first candle’s body.
4. What does the Evening Star pattern indicate?
It may indicate that buying momentum is weakening and selling pressure is increasing. The pattern does not guarantee that prices will continue to fall.
5. Are Morning Star and Evening Star reversal patterns?
Yes. They are generally classified as bullish and bearish reversal patterns, respectively. Their signals should be assessed in the context of the preceding trend and subsequent price action.
6. Can these patterns be used for intraday trading?
They can be observed on intraday charts, but shorter timeframes may contain more price noise and false signals. Traders should consider the instrument, timeframe and broader market conditions.
7. Do Morning Star and Evening Star patterns require a gap?
No. Gaps may appear in some markets, but they are not essential to identifying either pattern. Gaps are less common in markets that trade continuously.
8. Which indicators can be used with these patterns?
Traders may examine volume, RSI, MACD, moving averages and nearby support or resistance levels. These tools can add context, but none guarantees that a pattern will work.
9. What is the main difference between Morning Star and Evening Star?
The Morning Star is a potential bullish reversal pattern that usually appears after a downtrend. The Evening Star is a potential bearish reversal pattern that usually appears after an uptrend.
10. Are Morning Star and Evening Star patterns reliable on their own?
No pattern is reliable in every market condition. These formations are best treated as one part of technical analysis rather than as standalone trading signals.

Blog by Aliceblue News Desk
The Alice Blue Team is a passionate group of analysts delivering expert market insights, comprehensive coverage of stocks, economy, commodities, and personal finance through clear, actionable research.