What Is the Three Black Crows Candlestick Pattern?
Blog by Aliceblue News Desk
18 February 2025
8 minutes
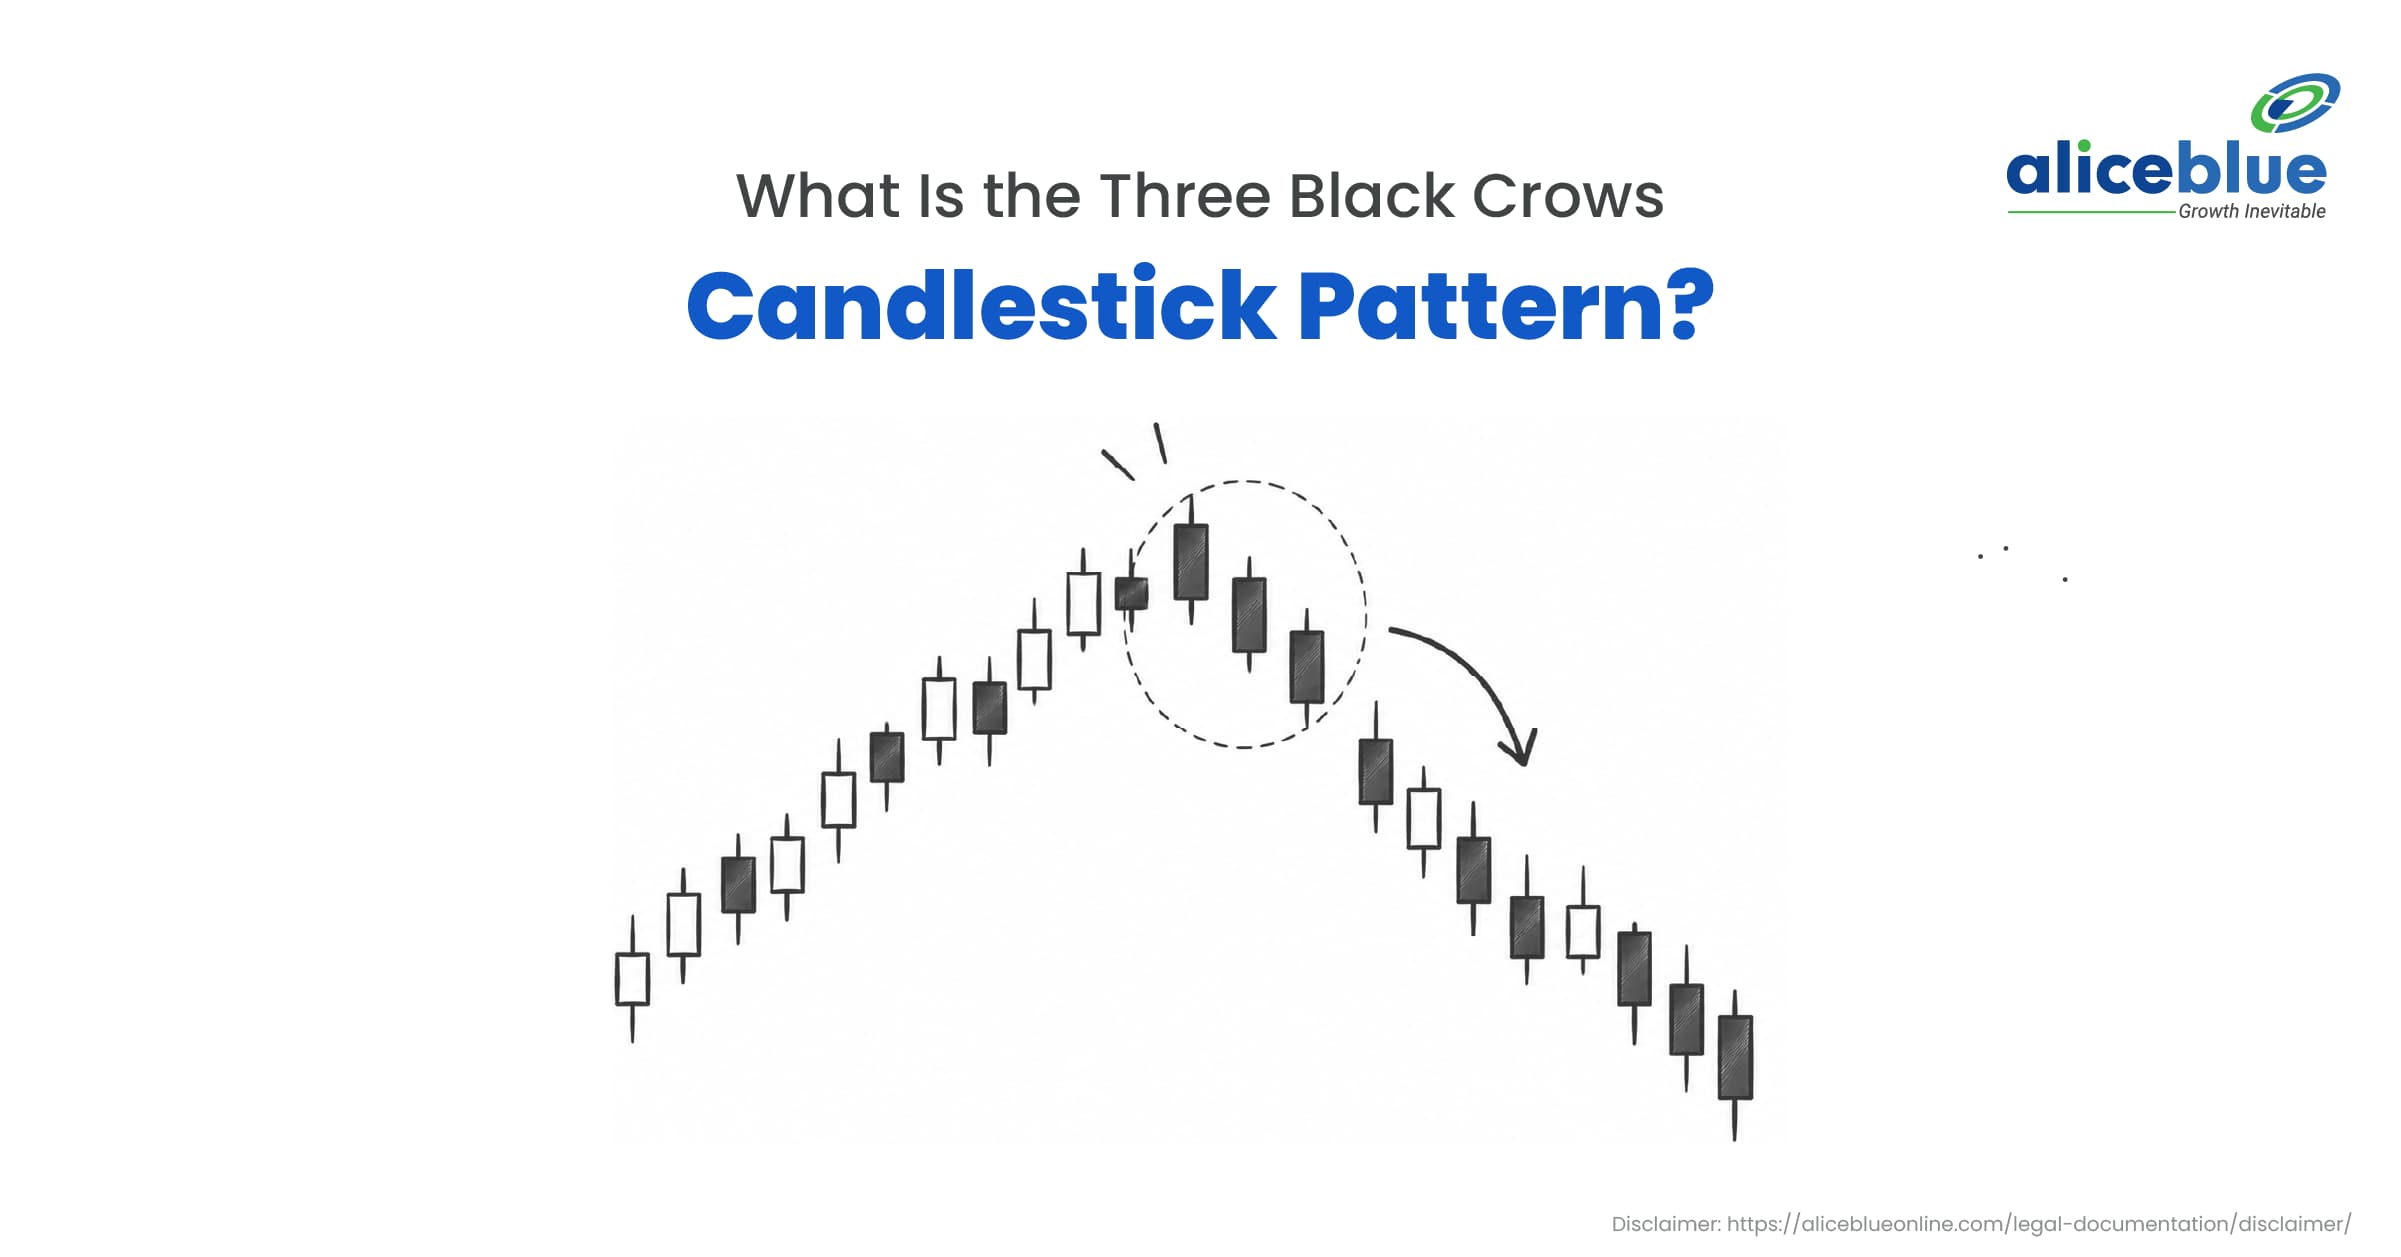
The Three Black Crows candlestick pattern is a bearish candlestick formation that may signal a trend reversal after an uptrend. It consists of three consecutive bearish candles, showing sustained selling pressure over three trading sessions.
Quick Definition
The Three Black Crows is a bearish candlestick pattern made up of three consecutive long bearish candles, each generally closing lower than the previous one. It typically appears after an uptrend and may indicate a shift from buying pressure to selling pressure.
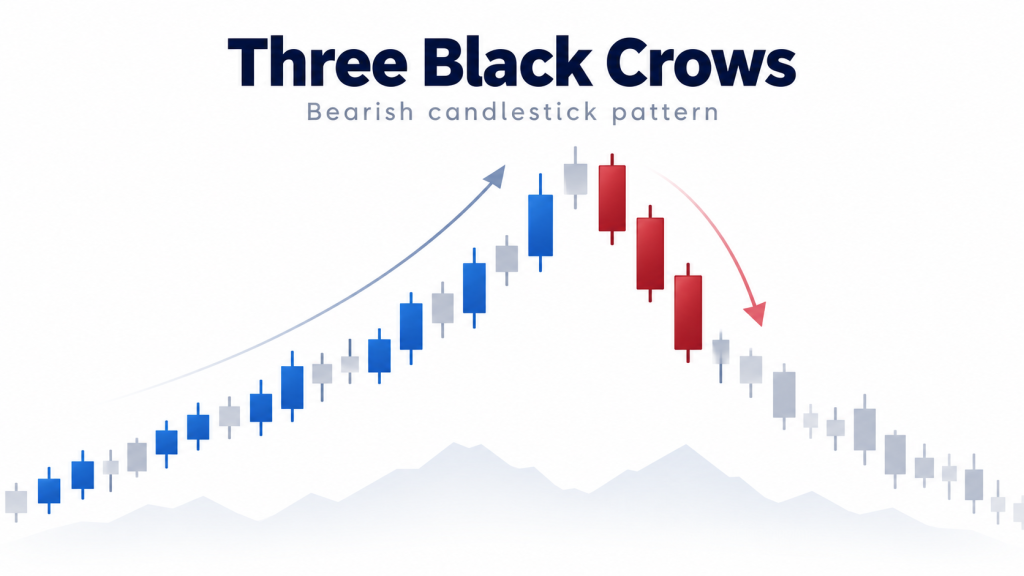

Table of Contents
- Three Black Crows Candlestick Pattern Meaning
- How to Identify the Three Black Crows Pattern
- Three Black Crows Pattern Formation and Structure
- Three Black Crows in Uptrends and Downtrends
- Reversal and Continuation Signals
- Three Black Crows vs Other Bearish Patterns
- Advantages of the Three Black Crows Pattern
- Limitations of the Three Black Crows Pattern
- Quick Summary
- FAQs
Three Black Crows Candlestick Pattern Meaning
The Three Black Crows is a bearish pattern that usually forms after an uptrend. It consists of three consecutive bearish candles, often with long bodies and relatively small wicks. Each candle closes lower than the previous one, indicating that selling pressure has persisted across three sessions.
The pattern suggests that buyers may be losing control and sellers are becoming more active. However, three declining candles do not automatically confirm a lasting trend reversal. The surrounding price action and broader market trend also matter.
Traders may examine trading volume, support levels and indicators such as the Relative Strength Index (RSI) or moving averages to assess whether the pattern signals a possible change in trend.
How to Identify the Three Black Crows Candlestick Pattern
Look for the following features when identifying the pattern:
- An existing uptrend: The pattern generally forms after a period of rising prices.
- Three consecutive bearish candles: Each candle closes below the previous candle’s closing price.
- Long candle bodies: The candles show substantial downward price movement during each session.
- Opens within the previous candle’s body: The second and third candles commonly open within the real body of the preceding candle.
- Closes near the session lows: Relatively small lower wicks can indicate that sellers maintained pressure towards the end of each session.
The exact candle shapes may vary. The pattern does not require every candle to have no wicks, and volume does not have to rise on every candle for the formation to qualify.
Three Black Crows Pattern Formation and Structure
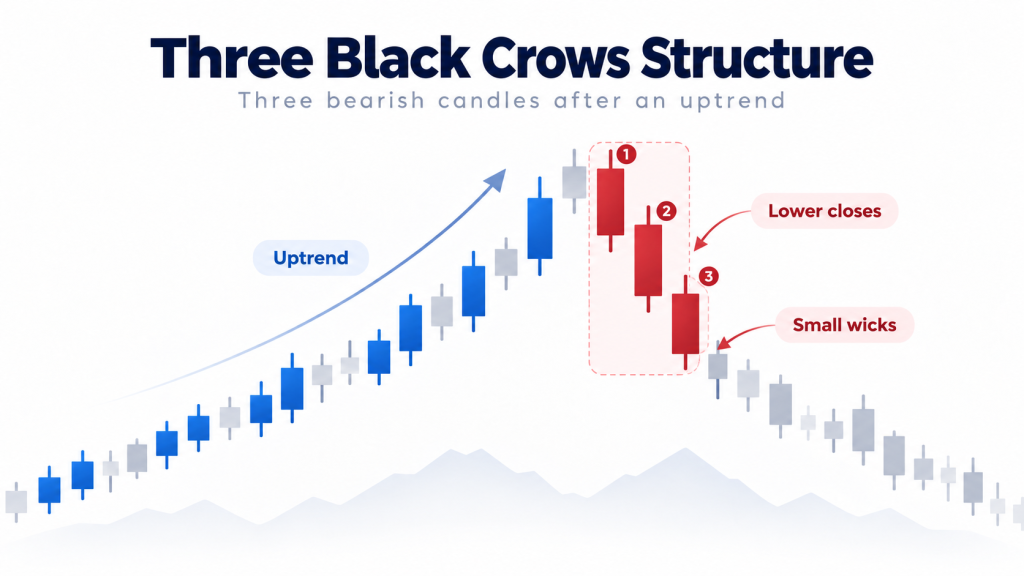
The pattern develops over three candles:
- First candle: A long bearish candle appears after an uptrend, suggesting that selling pressure is increasing.
- Second candle: Another bearish candle closes below the first candle’s close, showing that downward pressure has continued.
- Third candle: A third bearish candle closes below the second candle’s close, indicating sustained selling across the formation.
The sequence can signal a shift in market sentiment, but the candles alone cannot establish whether the decline will continue. Traders often assess the price level where the pattern appears and what happens after the third candle.
Three Black Crows in Uptrends and Downtrends
In an Uptrend:
The Three Black Crows pattern is commonly interpreted as a potential bearish reversal when it appears after an uptrend. Three consecutive bearish candles may indicate that buying momentum is weakening and selling pressure is increasing.
The signal may carry more context if the pattern forms near resistance or is followed by further weakness. However, it does not guarantee that the uptrend has ended.
In a Downtrend:
When a similar three-candle formation appears during an existing downtrend, it may reflect continued selling pressure. However, the Three Black Crows is primarily classified as a reversal pattern, so a formation within an established downtrend should be interpreted in the context of the preceding price action.
Traders should avoid assuming that every sequence of three bearish candles represents a valid pattern or confirms further declines.
Three Black Crows: Reversal and Continuation Signals
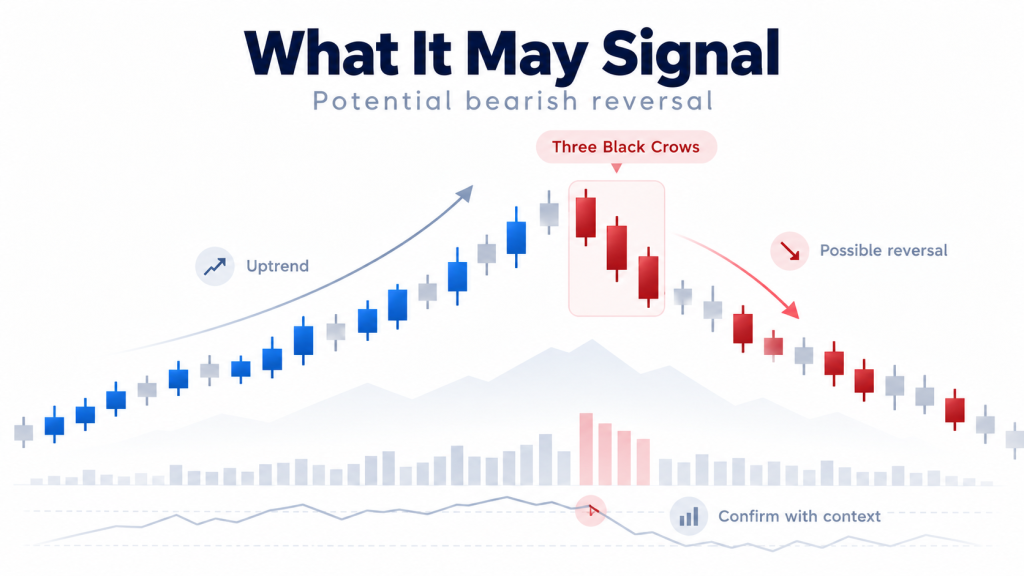
The main use of the Three Black Crows pattern is to identify a possible bearish reversal after an uptrend.
In this context, the three declining candles suggest that sellers have become more active over several sessions. A subsequent move below a nearby support level may provide additional evidence of weakness, although it does not guarantee a sustained downtrend.
During an existing downtrend, three consecutive bearish candles may simply reflect ongoing downward movement rather than a new reversal. Traders should distinguish between a possible change in trend and the continuation of an existing move.
Volume, support and resistance, and other technical indicators can help provide context. None of these tools can eliminate false signals.
Three Black Crows vs Other Bearish Candlestick Patterns
The Three Black Crows differs from other bearish candlestick patterns mainly in its structure and the price action it represents.
| Pattern | Structure | Typical Interpretation | Usual Context |
| Three Black Crows | Three consecutive bearish candles with lower closes | Sustained selling pressure | Usually after an uptrend |
| Bearish Engulfing | A bearish candle’s real body engulfs the previous bullish candle’s real body | Possible shift towards selling pressure | Often after an uptrend |
| Evening Star | A bullish candle, a small-bodied candle and a bearish candle | Possible bearish reversal | Usually after an uptrend |
| Hanging Man | A small real body near the top of the candle’s range with a long lower wick | Possible bearish warning | After an uptrend |
No pattern is automatically more reliable than the others in every market condition. The trend, candle formation and subsequent price action influence how each pattern should be interpreted.
Limitations of Three Black Crows Candlestick Pattern
The main limitation of the Three Black Crows pattern is that it can sometimes generate false signals, especially in oversold conditions. While it indicates bearish momentum, traders must confirm it with technical indicators to avoid misleading interpretations and prevent unnecessary trading risks.
- May Occur in Oversold Markets: If the pattern forms when the market is already oversold, further downside movement may be limited. Instead of a strong downtrend, the price may consolidate or even reverse, leading to potential false signals.
- Requires Confirmation for Accuracy: Relying solely on the pattern can be risky. Traders need to use additional indicators like RSI, MACD, or volume analysis to validate the signal and avoid mistaking temporary pullbacks for full-trend reversals.
- Not Always Reliable in Low Liquidity Markets: In stocks or assets with low liquidity, the pattern may form due to random price fluctuations rather than genuine selling pressure. This can reduce its effectiveness and increase the chances of misinterpretation.
- Potential for Short-term Retracements: Even in a strong downtrend, prices may briefly retrace or consolidate after the pattern appears. Traders must be cautious about entering positions without considering key support levels and overall market conditions.
Advantages of the Three Black Crows Candlestick Pattern
- Easy to recognise: The three consecutive bearish candles create a distinctive formation.
- Shows sustained selling pressure: The lower closes across three sessions indicate continued downward movement.
- Provides possible reversal clues: After an uptrend, the pattern may alert traders to a change in market sentiment.
- Can be combined with other tools: Support and resistance, volume and technical indicators can provide additional context.
- Applicable across markets: Similar formations may appear in stocks, currencies and commodities, though their interpretation depends on the instrument and timeframe.

Limitations of the Three Black Crows Candlestick Pattern
- False reversal signals: The pattern may appear without a lasting change in the prevailing trend.
- Late identification: By the time the third candle closes, the price may have already fallen considerably.
- Support levels can interrupt the decline: Prices may pause, consolidate or rebound near an important support zone.
- Market conditions affect interpretation: Low liquidity, sudden news and short-term price fluctuations can affect the appearance of the pattern.
- No guarantee of further declines: Three bearish candles do not establish how far the price may fall or whether selling pressure will continue.
Traders should consider the broader trend and their risk limits rather than relying on the candlestick pattern alone.
Three Black Crows Candlestick Pattern – Quick Summary
The Three Black Crows is a bearish candlestick pattern that generally appears after an uptrend. It consists of three consecutive bearish candles, each closing below the previous one.
The pattern may indicate that selling pressure is increasing and the existing uptrend is weakening. Traders often assess support and resistance, volume and other technical indicators before interpreting it as a possible reversal. The pattern is not a guarantee of further price declines and should be considered alongside other market information.
Three Black Crows Candlestick Pattern – FAQs
1. What is the Three Black Crows candlestick pattern?
The Three Black Crows is a bearish candlestick pattern consisting of three consecutive bearish candles, each generally closing lower than the previous one. It usually appears after an uptrend and may indicate increasing selling pressure.
2. What does the Three Black Crows pattern indicate?
It may indicate that sellers are gaining control and buying momentum is weakening. When it appears after an uptrend, it can signal a possible bearish reversal.
3. How do you identify the Three Black Crows pattern?
Look for three consecutive bearish candles after an uptrend. Each candle should close below the previous candle’s close, and the candles commonly have long bodies and relatively small wicks.
4. Is the Three Black Crows pattern bullish or bearish?
It is a bearish pattern. It is generally associated with a possible reversal from an uptrend to a downtrend.
5. How reliable is the Three Black Crows pattern?
Its usefulness depends on the market context, preceding trend and subsequent price action. It can produce false signals, so it should not be treated as a standalone trading signal.
6. How can traders confirm the Three Black Crows pattern?
Traders may examine subsequent price action, nearby support levels, volume and indicators such as RSI or moving averages. These tools provide additional context but cannot guarantee that the price will continue falling.

Blog by Aliceblue News Desk
The Alice Blue Team is a passionate group of analysts delivering expert market insights, comprehensive coverage of stocks, economy, commodities, and personal finance through clear, actionable research.