


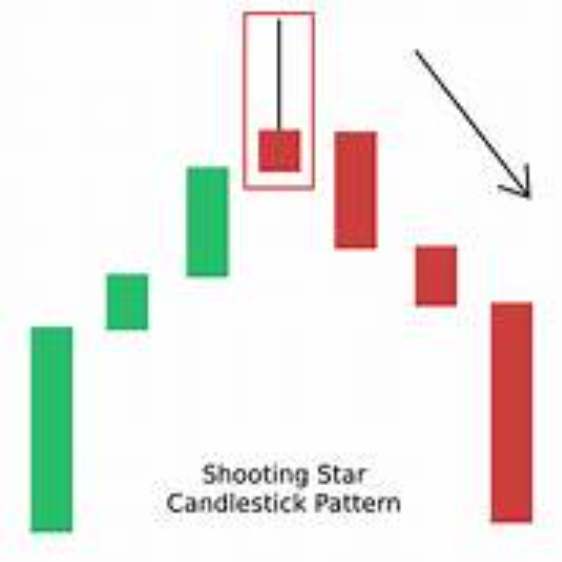
The Shooting Star candlestick pattern is a bearish reversal signal that appears after an uptrend. It has a small body, long upper wick, and little to no lower wick, indicating buying pressure followed by strong selling, suggesting a potential trend reversal downward.
Shooting Star Candlestick Meaning
The Shooting Star candlestick pattern is a bearish reversal signal that appears after an uptrend. It has a small real body, a long upper wick, and little to no lower wick, indicating that buyers pushed prices up before sellers regained control.
This pattern suggests weakness in the current trend as buyers fail to maintain higher levels. The long upper wick shows rejection of higher prices, signaling that sellers are gaining strength. Traders look for confirmation with the next bearish candle before taking action.
A Shooting Star alone isn’t always reliable. Traders should use technical indicators like RSI, MACD, or volume analysis to confirm trend reversals. If followed by a strong bearish candle, it increases the probability of a downward trend continuation.

Shooting Star Candlestick Example
For example, suppose a stock is in an uptrend and opens at ₹1,500, reaches ₹1,550, but closes at ₹1,505, forming a Shooting Star. The long upper wick shows that sellers overpowered buyers, rejecting higher prices.
If the next day’s candle opens lower and closes bearish, it confirms a potential trend reversal. Traders may enter short positions below the Shooting Star’s low, setting stop-losses above the high to mitigate risks.
This pattern is often seen in stocks, forex, and commodities, signaling a shift in market sentiment. The Shooting Star works best when combined with support/resistance levels, Fibonacci retracements, or moving averages.
Types Of Shooting Star Candlestick
The main types of Shooting Star candlestick patterns include the classic Shooting Star, bearish Shooting Star, and inverted Shooting Star. Each signals potential trend reversals but differs in shape, confirmation requirements, and reliability, depending on market conditions and technical indicators used.
- Classic Shooting Star: Forms after an uptrend, with a small real body near the low and a long upper wick, signaling buyer exhaustion and potential bearish reversal when followed by a strong bearish confirmation candle.
- Bearish Shooting Star: Appears at major resistance levels with higher trading volume, increasing reversal probability. It often precedes strong downward movements, especially when accompanied by RSI divergence, MACD crossovers, or trendline rejections.
- Inverted Shooting Star: Looks like a Shooting Star but occurs after a downtrend. It resembles an Inverted Hammer, suggesting temporary bullish pressure but still requires confirmation with a bearish follow-up candle before signaling a strong downtrend continuation.
How To Read Shooting Star Candlestick Pattern?
Reading a Shooting Star involves identifying its key structure—a small body near the low, a long upper wick, and a minimal lower wick—indicating buyer exhaustion and increased selling pressure after an uptrend.
Traders must observe the next candle to confirm the pattern. If followed by a bearish candle with a strong volume, it strengthens the reversal signal. A lack of confirmation can lead to false signals, making additional analysis essential.
The location of the Shooting Star is critical. If formed at a resistance level or after a strong rally, it holds greater significance. Combining it with trendlines and technical indicators improves trading accuracy.
How To Trade Shooting Star Candlestick Pattern
To trade the Shooting Star, wait for confirmation with a bearish candle. A short position is entered below the Shooting Star’s low, with a stop-loss above the high to limit risks.
Traders can enhance accuracy using RSI for overbought signals or MACD for bearish crossovers. If the Shooting Star forms at a major resistance level, it strengthens the trend reversal probability.
For better risk management, traders should target previous support zones as exit points. Combining the Shooting Star with volume spikes, moving averages, or Bollinger Bands improves success rates in identifying trend reversals.
Structure Of Shooting Star Candlestick
A Shooting Star consists of a small body at the lower end, a long upper shadow, and little or no lower shadow. This structure reflects an initial buying push followed by strong selling pressure, leading to a potential downtrend.
The long upper wick shows that buyers attempted to push the price higher but failed as sellers took control, driving the price near the opening level. The small body signifies indecision before reversal.
The strength of the reversal increases when the Shooting Star appears at key resistance levels, Fibonacci retracements, or trendline breakouts, making it a more reliable bearish signal.
Difference Between Shooting Star And Inverted Hammer
The main difference between Shooting Star and Inverted Hammer lies in their trend placement and implications. A Shooting Star appears after an uptrend, signaling a bearish reversal, while an Inverted Hammer forms after a downtrend, indicating a potential bullish reversal with confirmation.
| Aspect | Shooting Star | Inverted Hammer |
| Trend Placement | Appears after an uptrend | Forms after a downtrend |
| Indication | Bearish reversal signal | Bullish reversal signal |
| Candle Structure | Small body near the low, long upper wick, little/no lower wick | Small body near the low, long upper wick, little/no lower wick |
| Market Sentiment | Buying pressure fails, selling pressure dominates | Selling pressure weakens, buying interest increases |
| Confirmation Needed? | Requires a bearish candle for strong reversal | Needs a bullish candle for confirmation |
| Trading Strategy | Short positions after confirmation | Long positions after confirmation |
| Reliability | Stronger at resistance levels | Stronger at support zones |
Benefits Of Shooting Star Candlestick Pattern
The main benefits of the Shooting Star candlestick pattern include its strong bearish reversal signal, ease of identification, and effectiveness in trend analysis. It helps traders spot market weakness, set precise entry/exit points, and manage risk efficiently in volatile trading conditions.
- Reliable Bearish Reversal Signal: The Shooting Star indicates potential trend reversals, helping traders identify selling opportunities after an uptrend, especially when confirmed with high volume and a strong bearish follow-up candle.
- Easy Identification: This pattern is simple to recognize, featuring a small body, long upper wick, and little/no lower wick, making it useful for traders of all experience levels in spotting trend shifts.
- Effective in Risk Management: Traders can place stop-loss orders above the high of the Shooting Star, ensuring better risk-reward ratios, reducing potential losses, and improving overall trading discipline.
- Works Well with Technical Indicators: When combined with RSI, MACD, Bollinger Bands, and trendlines, the Shooting Star enhances trading accuracy by confirming bearish momentum shifts.
- Applicable Across Markets: The Shooting Star is effective in stocks, forex, and commodities, making it a versatile trading tool for spotting market weaknesses and potential downtrends in various financial instruments.
Limitations Of Shooting Star Candlestick Pattern
The main limitations of the Shooting Star candlestick pattern include its dependence on confirmation, occurrence of false signals, and limited standalone reliability. Without volume support or bearish confirmation, it can mislead traders, making it essential to use additional technical indicators for accuracy.
- Requires Confirmation: A Shooting Star alone is not a strong signal. Traders need a bearish follow-up candle and volume support to confirm the trend reversal, reducing the risk of false entries.
- Prone to False Signals: In strong uptrends, a Shooting Star may fail to reverse the trend, leading to false signals if traders enter short positions without additional confirmation from indicators like RSI or MACD.
- Limited Standalone Reliability: Without support from trendlines, resistance levels, or other indicators, the Shooting Star loses effectiveness. It is best used with technical tools like moving averages and Fibonacci retracements.
- Ineffective in Ranging Markets: Shooting Stars work best in trending markets. In sideways movements, they lack clear significance, making it difficult to differentiate between a genuine reversal and temporary price fluctuation.
- Market Sentiment Can Overpower the Signal: In bullish market conditions, a Shooting Star may not lead to a downtrend if overall sentiment remains positive, causing unexpected price movements despite the bearish signal.
Shooting Star And Other Candlestick Formations
The Shooting Star is similar to other bearish candlestick patterns like Inverted Hammer, Gravestone Doji, and Bearish Engulfing. However, its strength depends on context and confirmation.
Unlike the Inverted Hammer, which appears after a downtrend, the Shooting Star forms after an uptrend, signaling potential weakness. Compared to a Bearish Engulfing, the Shooting Star lacks a strong downward confirmation within the same candle.
To improve reliability, traders combine Shooting Stars with trend analysis, support/resistance levels, and technical indicators like RSI and MACD. This approach minimizes false signals and enhances trading decisions in volatile markets.
To understand the topic and get more information, please read the related stock market articles below.
Shooting Star Candlestick Pattern – Quick Summary
- The Shooting Star candlestick pattern signals a bearish reversal after an uptrend. Its small body, long upper wick, and minimal lower wick indicate strong selling pressure, suggesting potential downward movement in price.
- A stock forming a Shooting Star at ₹1,550 but closing near ₹1,505 signals rejection of higher prices. If confirmed by a bearish candle, traders may enter short positions below the low, using stop-losses above the high for risk management.
- The main types of Shooting Star patterns include the classic, bearish, and inverted Shooting Star. Each signals potential trend reversals, but confirmation and reliability depend on market conditions and additional technical indicators.
- Reading a Shooting Star involves recognizing its structure: a small body near the low, a long upper wick, and little or no lower wick, indicating buyer exhaustion and strong selling pressure, leading to a possible trend reversal.
- To trade the Shooting Star, wait for confirmation with a bearish candle. Enter short positions below the low, set stop-losses above the high, and use indicators like RSI, MACD, or volume spikes for better accuracy and risk management.
- A Shooting Star forms with a small body at the lower end, a long upper wick, and minimal lower shadow, reflecting strong initial buying pressure followed by aggressive selling, making it a key bearish reversal signal.
- The main difference between a Shooting Star and an Inverted Hammer is their placement. A Shooting Star appears after an uptrend, signaling a bearish reversal, while an Inverted Hammer occurs after a downtrend, indicating a potential bullish reversal.
- The main benefits of the Shooting Star include its strong bearish reversal signal, ease of identification, and effectiveness in trend analysis, helping traders recognize market weakness, set entry/exit points, and manage risk efficiently.
- The main limitations of the Shooting Star pattern include its need for confirmation, risk of false signals, and low standalone reliability. Traders should use additional technical indicators like RSI or volume analysis to improve accuracy.
- Open a free demat account with Alice Blue in 15 minutes today! Invest in Stocks, Mutual Funds, Bonds & IPOs for Free. Also, trade at just ₹ 20/order brokerage on every order.

Shooting Star Candlestick Pattern Meaning – FAQs
A Shooting Star candlestick pattern is a bearish reversal signal that appears after an uptrend. It has a small real body, a long upper wick, and little to no lower wick, indicating buyer exhaustion and potential trend reversal.
There is no specific formula for a Shooting Star, but it is identified by its structure:
Small body near the low
Long upper wick (at least twice the body length)
Minimal or no lower wick
A Shooting Star forms after an uptrend, signaling that buyers attempted to push the price higher but failed as sellers regained control. If followed by a bearish confirmation candle, it increases the probability of a downtrend.
No, a Shooting Star is bearish because it signals a potential reversal from an uptrend to a downtrend. However, it requires confirmation with a bearish candle to validate the signal and avoid false breakouts.
Yes, a Shooting Star can be green (bullish close), but it is more effective when red (bearish close). A green Shooting Star still shows buyer rejection, but the bearish impact is stronger with a red close.
No, a Shooting Star is not a Doji, but they share similarities. A Doji has almost equal open and close prices, while a Shooting Star has a small body near the low and a long upper wick.
To trade a Shooting Star:
Wait for confirmation with a bearish candle.
Enter a short position below the low of the Shooting Star.
Place a stop-loss above the high and set profit targets at support levels.
Yes, the Shooting Star works in crypto trading, signaling potential bearish reversals after an uptrend. It is more reliable when used with support/resistance levels, RSI overbought signals, and bearish volume confirmation to avoid false breakouts.
We hope that you are clear about the topic. But there is more to learn and explore when it comes to the stock market, commodity and hence we bring you the important topics and areas that you should know:
Disclaimer: The above article is written for educational purposes and the companies’ data mentioned in the article may change with respect to time. The securities quoted are exemplary and are not recommendatory.


