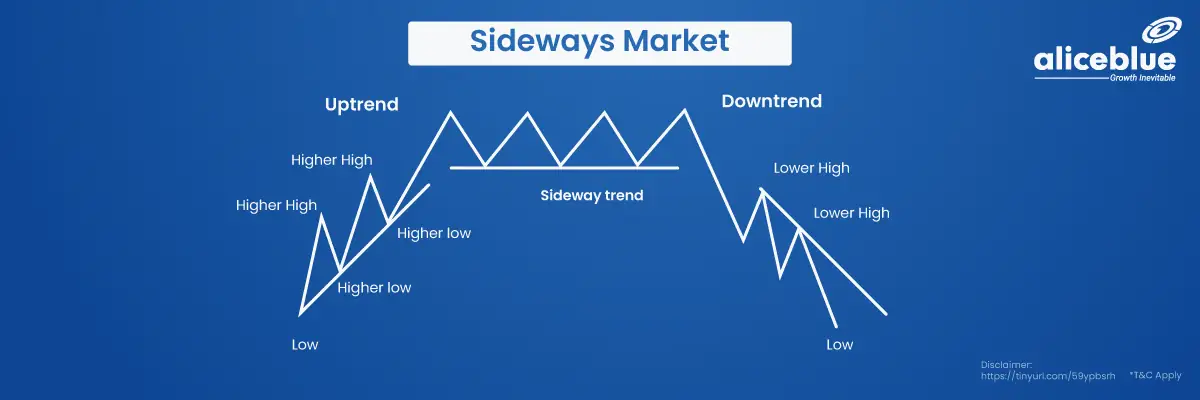
A sideways market, also called a range-bound market or a sideways drift market, is one in which there are no clear upward or downward trends for a long time. When this happens, the prices of stocks, commodities, and securities move back and forth within a set range, set by established support and resistance levels.
Contents:
- What Is Sideways Market?
- Characteristics of sideways market
- How To Identify Sideways Market?
- Sideways Market Indicator
- Benefits of Trading a Sideways Market
- Limitations of Trading a Sideways Market
- What Is Sideways Market – Quick Summary
- Sideways Market -FAQs
What Is Sideways Market?
In a sideways market, the prices of assets do not move much up or down; they stay in a narrow range. This kind of market situation usually happens when supply and demand are equal.
A real-world example of a sideways market is the case of Hindustan Unilever (HUL), which experienced a sideways trend for more than six years between 2004 and 2010-11. During this period, the stock price of HUL remained within a specific range, lacking a strong upward or downward momentum. However, post this sideways phase, the stock witnessed a substantial appreciation, increasing nearly 8 to 10 times in value as of 2020.
Characteristics of sideways market
The primary characteristic of a market moving sideways is the absence of any discernible trend.
Other distinguishing features include the following:
- Price Range: In a sideways market, there is a defined price range where the asset price doesn’t go beyond certain high and low points, known as resistance and support levels.
- Volume: The trading volume may decrease in a sideways market since traders might be uncertain and prefer to wait for a clearer market direction.
- Volatility: There’s lower volatility in a sideways market compared to trending markets. Prices move within a certain range without making significant highs or lows.
- Duration: Sideways markets can last for varying durations, from weeks to even years, depending on market conditions and other influencing factors.
- Indecision: The market shows indecision as neither the buyers nor the sellers can take the price significantly up or down.
- Market Catalyst: The absence of a strong market catalyst means nothing to push the prices significantly higher or lower.
How To Identify Sideways Market?
To identify a sideways market, observe consistent price ranges, lower trading volumes, flat moving averages, and an RSI around 50, indicating stable prices with no clear trend.
To identify a sideways market, here are key signs and tools used:
- Consistent Price Movement: Look for price movements that stay within a defined range over a period of time.
- Lower Trading Volumes: Check if trading volumes are lower than usual, as this can indicate a sideways market.
- Flatter Moving Averages: A flat moving average line can indicate a sideways market.
- RSI (Relative Strength Index): RSI around the neutral 50 level can indicate a lack of strong momentum in either direction.
Sideways Market Indicator
Best Indicator For Sideways Market include Bollinger Bands for volatility, MACD for trend changes, RSI for overbought/oversold conditions, and Stochastic Oscillator for price placement in range.
- Bollinger Bands: Helps in identifying the volatility and possible price levels.
- Moving Average Convergence Divergence (MACD): Useful in spotting changes in the strength, direction, momentum, and duration of a trend.
- Relative Strength Index (RSI): Indicates overbought or oversold conditions.
- Stochastic Oscillator: Shows the location of the close relative to the high-low range over a set number of periods.
Benefits of Trading a Sideways Market
The primary benefit of trading in a sideways market is that it offers predictable price ranges, lower volatility, and opportunities for asset accumulation at lower prices through range-bound strategies.
Other benefits include:
- Predictable Price Ranges: Prices move within a known range, making it somewhat predictable.
- Lower Volatility: Lower risk due to less price fluctuation.
- Potential Accumulation of Assets: Opportunity to accumulate assets at lower prices.
Limitations of Trading a Sideways Market
The major limitation of trading in a sideways market is the lack of a clear price trend.
Other limitations include:
- Limited Profit Potential: Profit opportunities are limited due to lack of strong price movement.
- Challenging for Trend-following Traders: Those who follow trends may find it difficult to trade in a sideways market.
- Longer Investment Horizon Needed: It may require a longer time to see appreciable gains.
We hope that you are clear about the topic. But there is more to learn and explore when it comes to the stock market, commodity and hence we bring you the important topics and areas that you should know:
What Is Sideways Market – Quick Summary
- The sideways market has a defined price range with no upward or downward trend.
- Identifying a sideways market involves observing price movements, trading volumes, and using technical analysis tools.
- Various indicators like Bollinger Bands and RSI can be helpful.
- Trading in a sideways market can have benefits like predictable price ranges but also limitations like limited profit potential.
- Begin your investment journey for free with Alice Blue. Most importantly, with our 15 Rs brokerage plan, you can save up to ₹ 1100 brokerage monthly. We also don’t levy clearing charges.
Sideways Market – FAQs
What Is a Sideways Market?
A sideways market is a phase where prices fluctuate within a set range without a clear trend, often due to equal forces of supply and demand.
Which strategy is best for the sideways market?
For sideways markets, range-bound trading strategies, which capitalize on the defined price range, are frequently regarded as the most effective.
How do you identify a sideways market?
To identify a sideways market, observe consistent price movement within a defined range, notice any decrease in trading volumes, and use technical analysis tools like flatter moving averages and an RSI around the neutral 50 level.
What is the difference between a trending market and sideways market?
The main difference between a trending and sideways market is the presence of a clear upward or downward trend in a trending market, whereas a sideways market lacks such a trend.
How long do sideways markets last?
How long a sideways market lasts depends on a lot of things, like how people feel about it and what news events might have an effect on prices. On the contrary, its typical duration does not exceed a few weeks.
Is it good to trade in sideways market?
Trading in a sideways market can be profitable with the right strategies, like range-bound trading, although it may not suit all traders, especially trend-following traders.
Is sideways market volatile?
Sideways markets are generally less volatile than trending markets as the prices move within a defined range without a clear upward or downward trend.
To understand the topic and get more information, please read the related stock market articles below.